Download

1 / 22
220 likes | 254 Vues
Redes RBF no MATLAB 6.1. Aproximação de uma Função. Função módulo de seno unitário, f = 1 Hz. Definição dos Padrões de Entrada. 10 neurônios: t10 = 0:0.1:0.9; 50 neurônios: t50 = 0:0.02:0.98;. Definição dos Padrões de Saída. y10 = abs(sin(2*pi*t10)); y50 = abs(sin(2*pi*t50));.

E N D
Aproximação de uma Função • Função módulo de seno unitário, f = 1 Hz
Definição dos Padrões de Entrada • 10 neurônios: t10 = 0:0.1:0.9; • 50 neurônios: t50 = 0:0.02:0.98;
Definição dos Padrões de Saída • y10 = abs(sin(2*pi*t10)); • y50 = abs(sin(2*pi*t50));
Definição dos Padrões de Teste • t10t = 0:0.001:0.9; • t50t = 0:0.0002:0.98;
Definição dos Resultados Esperados • y10t = abs(sin(2*pi*t10t)); • y50t = abs(sin(2*pi*t50t));
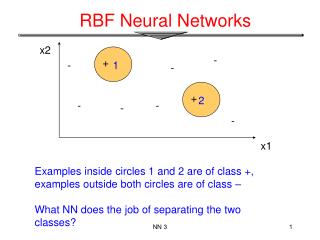
Definição das Redes • Network name: network1 • Tipo: Radial basis (exact fit) • Input data: Set to input (t10) • Target data: Set to target (y10) • Spread Constant: 0.01
Definição das Redes • Network name: network2 • Tipo: Radial basis (exact fit) • Input data: Set to input (t10) • Target data: Set to target (y10) • Spread Constant: 1.0
Definição das Redes • Network name: network3 • Tipo: Radial basis (exact fit) • Input data: Set to input (t10) • Target data: Set to target (y10) • Spread Constant: 100.0
Definição das Redes • Network name: network4 • Tipo: Radial basis (exact fit) • Input data: Set to input (t50) • Target data: Set to target (y50) • Spread Constant: 0.01
Definição das Redes • Network name: network5 • Tipo: Radial basis (exact fit) • Input data: Set to input (t50) • Target data: Set to target (y50) • Spread Constant: 1.0
Definição das Redes • Network name: network6 • Tipo: Radial basis (exact fit) • Input data: Set to input (t50) • Target data: Set to target (y50) • Spread Constant: 100.0
Visualizando os Resultados Redes com 10 neurônios >> figure >> plot(t10t, y10t, ’k’) >> hold on >> plot(t10t, s1, ’r’) >> plot(t10t, s2, ’b’) >> plot(t10t, s3, ’m’)
Visualizando os Resultados Redes com 50 neurônios >> figure >> plot(t50t, y50t, ’k’) >> hold on >> plot(t50t, s4, ’r’) >> plot(t50t, s5, ’b’) >> plot(t50t, s6, ’m’)