Download
1 / 15
150 likes | 446 Vues
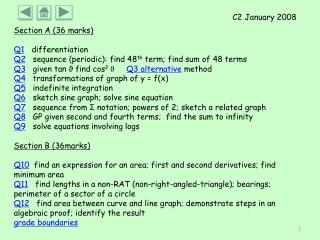
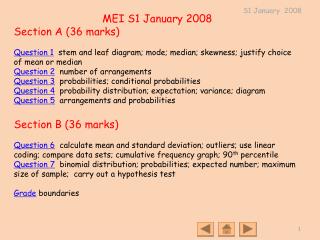
MEI S1 January 2008 Section A (36 marks) Question 1 stem and leaf diagram; mode; median; skewness; justify choice of mean or median Question 2 number of arrangements Question 3 probabilities; conditional probabilities Question 4 probability distribution; expectation; variance; diagram

E N D
MEI S1 January 2008 Section A (36 marks) Question 1 stem and leaf diagram; mode; median; skewness; justify choice of mean or median Question 2 number of arrangements Question 3 probabilities; conditional probabilities Question 4 probability distribution; expectation; variance; diagram Question 5 arrangements and probabilities Section B (36 marks) Question 6 calculate mean and standard deviation; outliers; use linear coding; compare data sets; cumulative frequency graph; 90th percentile Question 7 binomial distribution; probabilities; expected number; maximum size of sample; carry out a hypothesis test Grade boundaries
1 Alice carries out a survey of the 28 students in her class to find how many text messages each sent on the previous day. Her results are shown in the stem and leaf diagram (i) Find the mode and median of the number of text messages [2] (ii) Identify the type of skewness of the distribution [1] Mode = 7 Median = 12.5 most of the data is at the lower end of the range so skewness = positive
(iii) Alice is considering whether to use the mean or the median as a measure of central tendency for these data • (A) In view of the skewness of the distribution, state whether Alice should choose the mean or the median [1] • (B) What other feature of the distribution confirms Alice’s choice? [1] • (iv) The mean number of text messages is 14.75. If each message costs 10 pence, find the total cost of all of these messages [2] in this case the fairer measure is the Median and the Mean would be affected by the large possible outlier of 58 total number of messages = 28 × 14.75 = 413 total cost = 413 × 10p = £41.30
2 Codes of three letters are made up using only the letters A, C, T, G Find how many different codes are possible (i) if all three letters used must be different [3] (ii) if letters may be repeated [2] (i) 4 choices for the first letter, 3 for the second and 2 for the third 4 × 3 × 2 = 24 different codes (ii) 4 choices for the first letter, 4 for the second and 4 for the third 4 × 4 × 4 = 64 different codes
3 Steve is going on holiday The probability that he is delayed on his outward flight is 0.3 The probability that he is delayed on his return flight is 0.2, independently of whether or not he is delayed on the outward flight (i) Find the probability that Steve is delayed on his outward flight but not on his return flight [2] (ii) Find the probability that he is delayed on at least one of the two flights [3] (iii) Given that he is delayed on at least one flight, find the probability that he is delayed on both flights [3] return (i) = 0.24 outward D = 0.06 0.2 (ii) = 0.06 + 0.24 + 0.14 D 0.3 0.8 D’ = 0.24 = 0.44 0.7 D = 0.14 0.2 (iii) = 0.06 ÷ 0.44 D’ 0.8 = 0.136 ( to 3 s f) D’ = 0.56
4 A company is searching for oil reserves. The company has purchased the rights to make test drillings at four sites. It investigates these sites one at a time but, if oil is found, it does not proceed to any further sites. At each site, there is probability 0.2 of finding oil, independently of all other sites. The random variable X represents the number of sites investigated. The probability distribution of X is shown below. (i) Find the expectation and variance of X [5] Var (X) = E(X2) – [E(X)]2 = 10.184 – 2.9522 Var (X) = 1.47 (to 3 sf) E(X) = Σr×P = 2.952 E(X2) = Σr2×P = 10.184
(ii) It costs £45 000 to investigate each site Find the expected total cost of the investigation [1] (iii) Draw a suitable diagram to illustrate the distribution of X [2] expected total cost = expected number of sites × £45 000 = 2.952 × £45 000 = £132 840 = £133 000 (to 3 sf)
5 Sophie and James are having a tennis competition. The winner of the competition is the first to win 2 matches in a row. If the competition has not been decided after 5 matches, then the player who has won more matches is declared the winner of the competition. For example, the following sequences are two ways in which Sophie could win the competition. (S represents a match won by Sophie; J represents a match won by James.) SJSS SJSJS (i) Explain why the sequence SSJ is not possible [1] (ii) Write down the other three possible sequences in which Sophie wins the competition [3] (iii) The probability that Sophie wins a match is 0.7 Find the probability that she wins the competition in no more than 4 matches [4] The sequence SSJ is not possible because after Sophie has won the first two matches, the competition is over. They would not play a third match. Sophie has already won. SS JSS JSJSS Prob (SS or JSS or SJSS) = 0.7×0.7 + 0.3×0.7×0.7 + 0.7×0.3×0.7×0.7 = 0.7399 = 0.740 (to 3sf)
6 The maximum temperatures x degrees Celsius recorded during each month of 2005 in Cambridge are given in the table below. These data are summarised by n = 12, Σx = 180.6, Σx2 = 3107.56. (i) Calculate the mean and standard deviation of the data [3] (ii) Determine whether there are any outliers [3] mean = 180.6 ÷ 12 standard deviation = √((3107.56 – 12 × 15.052) ÷ 11) = 15.05 = 5.950782989 … = 15.1 (to 3sf) = 5.95 (to 3sf) limits for outliers are mean ± 2 standard deviations 15.1 + 2 × 5.95 = 27 there are no outliers 15.1 - 2 × 5.95 = 3.2
(iii) The formula y = 1.8x + 32 is used to convert degrees Celsius to degrees Fahrenheit. Find the mean and standard deviation of the 2005 maximum temperatures in degrees Fahrenheit [3] (iv) In New York, the monthly maximum temperatures are recorded in degrees Fahrenheit. In 2005 the mean was 63.7 and the standard deviation was 16.0 Briefly compare the maximum monthly temperatures in Cambridge and New York in 2005 [2] From y = 1.8x + 32 (mean of y) = 1.8 × (mean of x) + 32 and (std dev of y) = 1.8 × (std dev of x) mean temp = 1.8 × 15.05 + 32 = 59.09 = 59.1°F (to 3 sf) standard deviation = 1.8 × 5.95 = 10.71 = 10.7°F (to 3 sf) New York has a higher average maximum temperature, so is warmer than Cambridge. New York has a bigger standard deviation so the maximum temperatures are more variable than in Cambridge
The total numbers of hours of sunshine recorded in Cambridge during the month of January for each of the last 48 years are summarised below. (v) Draw a cumulative frequency graph for these data [5] (vi) Use your graph to estimate the 90th percentile [2] 48 40 32 24 16 8 0 90th percentile 90% of 48 = 43.2 90th percentile = 166 hours
7 A particular product is made from human blood given by donors. The product is stored in bags. The production process is such that, on average, 5% of bags are faulty. Each bag is carefully tested before use. (i) 12 bags are selected at random. (A) Find the probability that exactly one bag is faulty [3] (B) Find the probability that at least two bags are faulty [2] (C) Find the expected number of faulty bags in the sample [2] X is the number of bags in the sample that are faulty X ~ B(12, 0.05) Binomial distribution: X ~ B(n, p) Prob (X = r) = nCr × pr × (1-p)n-r Prob (X=1) = 12C1 × 0.05 × 0.9511 = 0.341 (to 3 sf) Prob (X≥2) = 1 – Prob(X=0) – Prob(X=1) = 1 - 0.9512 – 0.3413 = 0.118 (to 3 sf) expected number = n × p = 12 × 0.05 = 0.6 bags
7 (ii) A random sample of n bags is selected. The production manager wishes there to be a probability of one third or less of finding any faulty bags in the sample. Find the maximum possible value of n, showing your working clearly [3] X ~ B(n, 0.05) Prob (X=any number) = Prob (X≥1) = 1 - Prob (X=0) = 1 - 0.95n use trial and improve to find n so that 1 – 0.95n is ⅓ or less n = 6 1 - 0.956 = 0.265 n = 7 1 - 0.957 = 0.302 n = 7 n = 8 1 - 0.958 = 0.337
7 (iii) A scientist believes that a new production process will reduce the proportion of faulty bags. A random sample of 60 bags made using the new process is checked and one bag is found to be faulty. Write down suitable hypotheses and carry out a hypothesis test at the 10% level to determine whether there is evidence to suggest that the scientist is correct [8] X ~ B(60, p) p is the probability of a bag being faulty 60 tested and 1 is faulty H0: p = 0.05 H1: p < 0.05 the scientist believes his new process will reduce the number of faulty bags This is a one-tail test. We need to see if Prob(X≤1) is less than 10% Prob (X≤1) = Prob(X=0) + Prob(X=1) 19.2% is greater than 10% so there is insufficient evidence to reject H0 = 0.9560 + 60 × 0.05 × 0.9559 = 0.192 (to 3 sf) OR insufficient evidence to say the scientist is correct insufficient evidence to say there has been a reduction in the number of faulty bags