Download
1 / 6
60 likes | 235 Vues
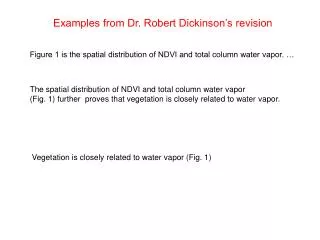
Examples from Dr. Robert Dickinson’s revision. Figure 1 is the spatial distribution of NDVI and total column water vapor. …. The spatial distribution of NDVI and total column water vapor (Fig. 1) further proves that vegetation is closely related to water vapor. .

E N D
Examples from Dr. Robert Dickinson’s revision Figure 1 is the spatial distribution of NDVI and total column water vapor. … The spatial distribution of NDVI and total column water vapor (Fig. 1) further proves that vegetation is closely related to water vapor. Vegetation is closely related to water vapor (Fig. 1)
To land surface climate system, biosphere and atmosphere are critical to surface energy budget. Both vegetation and atmosphere are critical to the energy budget of the land surface.
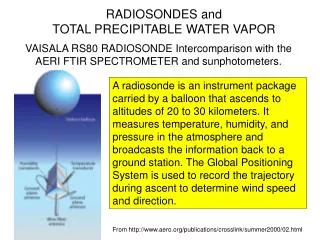
Uncertainties of satellite remotely sensed skin temperature over the Tibetan Plateau are mainly on three parts: first, cloud contamination makes no measurement under cloudy sky, namely, the MODIS skin temperature measurements are only available for clear times. Uncertainties of satellite remotely sensed skin temperature over the Tibetan Plateau are mainly of three kinds: first, cloud contamination, no measurement are made under cloudy sky, so, the MODIS skin temperature measurements are only available for clear times.
Clear constraint, as indicated in the dashed lines, implies that skin temperature and vegetation are determine by certain energy balance and can barely cross the constrains. Such shape have been reported previously (Tucker et al. 1986), and reasons for it is still unclear. The dashed lines indicates a limit of the skin temperature and vegetation that appear to be related to energy balance. Such a shape has been reported previously (Tucker et al. 1986), but its reasons are still unexplained.
A scatter plot of nighttime land skin temperatures and NDVI values from July 2000-July 2010 might suggest the stronger ability of vegetation to grow in a warm environment than in a cold environment (Fig. 8). A scatter plot of nighttime land skin temperatures and NDVI values from July 2000-July 2010 suggests that vegetation may grow in a warm environment better than in a cold environment (Fig. 8).
The spatial distribution of NDVI and total column perceptible water vapor (Fig. 9) further proves that vegetation is closely related to water vapor because of the vegetation evpotranspiration, a biophysical process that releases water vapor to the atmosphere. The spatial distribution of NDVI and total column precipitable water vapor (Fig. 9) indicates that vegetation and its evapotranspiration is closely related to water vapor.