Download
1 / 24
240 likes | 365 Vues
Trimodal distribution of ozone and water vapor in the UT/LS during boreal summer. WARM SEASON. Timothy J Dunkerton NorthWest Research Associates. Tropical Tropopause Layer (TTL). Contains critical questions for atmospheric chemistry and climate

E N D
Trimodaldistribution of ozone and water vapor in the UT/LS during boreal summer WARM SEASON Timothy J Dunkerton NorthWest Research Associates
Tropical Tropopause Layer (TTL) • Contains critical questions for atmospheric chemistry and climate • Represents the gateway for constituents entering the middle atmosphere • Composition and motion of air are influenced by a combination of tropospheric and stratospheric processes • Extends vertically from the level of maximum convective outflow (200-250 hPa) to the cold point tropopause or, alternatively, to the highest altitude of convective clouds, which sometimes overshoot the tropopause • Extends meridionally to the subtropical jet and tropopause break • BOREAL SUMMER: jet and tropopause break are displaced well to the north, near 45°N, and thermodynamic characteristics of tropical air extend into midlatitudes • BOREAL WINTER: rotational circulations more symmetric about equator, tropical tropopause temperatures attain their coldest values
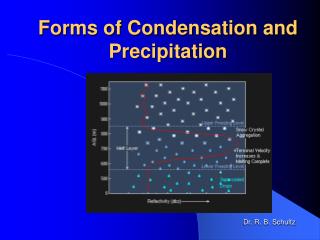
Ping Chen (1995 JGR) studied isentropic mixing in the middle world using ECMWF analyses DJF PVU=2 overworld upper & lower middle world middle world
Randel et al, 2001 Depletion by convection Transport Into tropics
Randel et al, 2001 Low O3 Wet High O3 Wet Low O3 Dry
Low O3 Wet High O3 Wet Low O3 Dry Randel et al, 2001
Randel et al, 2001 Cross-isentropic transport associated with deep convection and cirrus in active monsoon regions causes a provocative upward bulge of water vapor isopleths to isentropic surfaces lying above the tropical cold point. There are some interesting implications for the water-vapor tape recorder.
Randel et al, 2001 Summer hydration is contiguous to moist phase of tape recorder head.
Cold season convection near equator “hot” spots* Gettelman et al, 2002 *coldest cloud top
Image courtesy Mark Baldwin (used w/o permission)
HALOE levels 32-34 solid: 30-90 E 20-40 N open: 30-105 E 15-45 N
Preliminary conclusions from HALOE • Warm-season hydration of UT/LS is observed in a shallow layer about the tropopause • Visible after 1993, not due to Pinatubo aerosol contamination • N American and S Asian monsoons contribute • Asian summer monsoon is stronger and deeper • Extreme events are more likely over Asia • HALOE ozone agrees with SAGE: low ozone within Tibetan anticyclone, arm of higher O3 air drawn equatorward & westward over E China & Ind O • Orbital patternof data in midlatitudes suggests interannual variation, especially in local winter • Spotty pattern of data in tropics and subtropical monsoon regions suggests local and episodic sources • Origin of local anomalies unknown, possibly deep convection upstream