Download
1 / 78
790 likes | 1.16k Vues
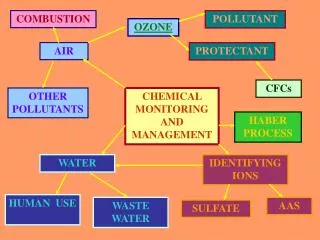
COMBUSTION. POLLUTANT. OZONE. AIR. PROTECTANT. CFCs. OTHER POLLUTANTS. CHEMICAL MONITORING AND MANAGEMENT. HABER PROCESS. WATER. IDENTIFYING IONS. HUMAN USE. WASTE WATER. AAS. SULFATE. CHEMICAL MONITORING AND MANAGEMENT.

E N D
COMBUSTION POLLUTANT OZONE AIR PROTECTANT CFCs OTHER POLLUTANTS CHEMICAL MONITORING AND MANAGEMENT HABER PROCESS WATER IDENTIFYING IONS HUMAN USE WASTE WATER AAS SULFATE
SUBSECTION 1Much of the work of chemists involves monitoring the reactants an products of reactions and managing reaction conditions
Subsection 1 1.2.1 & 1.3.1 • specific chemical occupation • named industry • branch of chemistry e.g. analytical chemistry • explain a chemical principle that the chemist uses • GC/GLC – adsorption, solubility (text example) • 1.2.2 collaboration between chemists – Text p. 198, 199
1.2.3 monitoring combustion • monitor emissions from combustion reactions in order to ensure minimum amounts of toxic materials released into environment • incomplete combustion – CO • sulfur compounds in coal & crude oil – SO2 • high temp in internal combustion engines – NO, NO2 • particulates – some of which come from combustion
Subsection 2Chemical processes in industry require monitoring and management to maximise production
Nitrogen Amino Acids R O H N C C O H H Nucleic Acids
THE HABER PROCESS The reaction of N2 gas with H2 gas to form NH3 that eventually comes to EQUILIBRIUM in a CLOSED SYSTEM. Under normal conditions of T and P reaction proceeds very SLOWLY and the position of equilibrium is far to the LEFT. N2(g) + 3H2(g) D2NH3DH = -92kJ bp -196oC bp -253oC bp -33oC
THE HABER PROCESS RAW MATERIALS • air a nitrogen • Fractional distillation of air • natural gas a hydrogen • From methane gas reacted with steam CH4(g) + 2H2O(g)g CO2(g) + 4H2(g)
THE PRODUCTION OF AMMONIA • manufacture of the reactant gases, N2, H2 • purification • compression • catalytic reaction to form NH3 • recovery of the NH3 • recycling of unreacted N2 and H2 THE SIX MAIN STEPS
THE HABER PROCESS The conflict between rate and extent of reaction (yield) – three key aspects need to be considered in choosing the conditions • the yield – how farthe reaction goes (how much NH3) • the rate – how fast the ammonia is formed • the energy account – how much energy can be saved/obtained
THE HABER PROCESS The compromise between temperature, pressure and yield of ammonia within the extreme positions of: • a high yield but low rate of reaction at low temperatures (e. g. 25oC) • a low yield but high rate of reaction at high temperatures (1000oC) • is achieved by using A CATALYST • its role is to permit a reduction in the operating temperature in the converter
THE HABER PROCESS • Catalyst lowers the activation energy so that the N2 bonds and H2 bonds can be more readily broken • At these lower temperatures, the reduced Ea via the catalyst means more reactant molecules have sufficient energy to overcome the energy barrier to reacting (activation energy) so the reaction is faster
YIELD OF AMMONIA • At each pass through the reactor, only about 15% of the reactants are converted into products under these conditions, but this is done in a short time period. • Ammonia is cooled and liquefied at the reaction pressure, & then removed as liquid ammonia. • The remaining mix of nitrogen and hydrogen gases (85%) are recycled & fed in at the reactant stage. • The process operates continuously & the overall conversion is about 98%.
MONITORING OF HABER PROCESS • incoming gas stream • ratio H2:N2 of 3:1 • pressure - too low and yield of NH3 drops, too high shortens the life of the reaction vessel and unsafe – pressure sensors monitor • sensors monitor levels CO and CO2 as poison catalyst CO(g) + H2O(g)n CO2(g) + H2(g) CO2(g) + H2O(l) + K2CO3(aq)n 2KHCO3(aq) • CO2 piped to urea plant where reacted with NH3 to form urea (NH2CONH2) or sold to brewers and soft drink manufacturers
MONITORING OF HABER PROCESS • optimum temperature in converter • temperature sensors monitor as too high damages catalyst and reduces yield • activity of catalyst • particle size monitored to ensure high surface area • purity of ammonia produced • energy use
THE HABER PROCESS 2.3.1 gather and process information from secondary sources to describe the conditions under which Haber developed the industrial synthesis of ammonia and evaluate its significance at that time in world history • case study
THE HABER PROCESS • Fritz Haber, German chemist, 1868-1934 • winner of the Nobel Prize in Chemistry (1918) for the synthesis of ammonia from its elements • Carl Bosh developed the industrial stages for the Haber process. The perfection of the Haber-Bosh process encouraged Germany to enter in World War I.
Case Study Demand for fertiliser • sources of fixed nitrogen • Chile saltpetre (NaNO3) exported to Europe in mid-19th century • coal-gas industry – ammoniacal liquor (NH3 in water) by-product processed to (NH4)2SO4 Explosives – nitroglycerine Dyestuffs - 1856 start of synthetic dyes – nitrogenous compounds
Case Study • all these demands could not be satisfied by Chile saltpetre • needed a process to fix atmospheric N2 • 1904-1908 Fritz Haber developed the process of synthesising NH3 from N2 and H2 • high pressure, 450oC, catalyst • Carl Bosch developed it as an industrial process - 30,000 tons by 1913
Case Study Political Unrest • Britain and allies controlled the sea-routes for Chile saltpetre • Germany cut off from this source of fixed N2 • WWI 1914 plant increased to 120,000 tons and a second plant up and running • Germany • increased munitions • increased fertiliser for food production
Case Study Social consequences of Haber process • prolonged WWI by 1-2 years – almost 1 million more deaths • vast expansion of production of fixed N2 for fertilisers
HABER PROCESS http://www.youtube.com/watch?v=c4BmmcuXMu8
3.2.1 deduce the ions present in a sample from the results of tests Cations – Ba2+, Ca2+, Pb2+, Cu2+, Fe2+, Fe3+ Anions - PO43-, SO42-, CO32-, Cl-
3.3.2 gather, process and present information to describe and explain evidence for the need to monitor levels of one of the above ions in substances used in society • Pb poisoning • PO43- - eutrophication of waterways leading to algae “blooms”
Chemical Analysis • Qualitative • identify what species are present in a sample e.g. vitamin tablet contains copper salt • Quantitative • determine the amount/concentration of species present in a sample e.g. vitamin tablet contains 1.2mg copper • volumetric, gravimetric, instrument - AAS
Identification of Ions • A solution contains Cl- ions. Identify an appropriate cation solution that could be added to detect the presence of these chloride ions. • A solution forms a white precipitate with carbonate ions and no precipitate with hydroxide ions. What common cation is most likely present in the solution?
Identification of Ions 3. A solution forms a precipitate with a solution of sodium phosphate, no precipitate with sodium sulfate and no precipitate with sodium chromate. What is the identity of the cation?
Identification of Ions Risk Assessment • moderately toxic – Ba cpds, AgNO3, (NH4)2MoO4 , CuSO4 , KSCN, NH3 solution • highly toxic – Pb cpds • waste collected in separate beaker – filter PbI2 • corrosive – 4M HNO3, 2M NaOH
Identification of Ions Hazard Minimisation • small quantities • fume cupboard for ammonia solution, good ventilation • safety glasses (corrosive solutions), lab coats • work near water supply and wash hand at end
Identification of Cations Lead (II) Pb2+(aq) + 2I-(aq)D PbI2(s) (canary yellow ppte) Copper(II) Cu2+(aq) + 2OH-(aq)D Cu(OH)2(s) (light blue ppte) Cu(OH)2(s) + 4NH3(aq)D [Cu(NH3)4]2+(aq)+ 2OH- (complex ion) (royal blue solution)
Identification of Cations Iron(II) Fe2+(aq) + 2OH-(aq)D Fe(OH)2(s) (greenish ppte) 3Fe2+(aq) + 2[Fe(CN)6]3-(aq)D Fe3[Fe(CN)6]2(s) (dark blue ppte)
Identification of Cations Iron(III) Fe3+(aq) + 3OH-(aq)D Fe(OH)3(s) (brown ppte) Fe3+(aq) + SCN-(aq)D FeSCN2+(aq) (complex ion) blood red
Identification of Cations Calcium Ca2+(aq) + CO32-(aq)D CaCO3(s) (white ppte) Barium Ba2+(aq) + CO32-(aq)D BaCO3(s) (white ppte)
Identification of Anions Carbonate CO32- (aq) + 2H+(aq) CO2(g) + H2O(l) pH of solution alkaline Chloride Cl-(aq) + Ag+(aq)D AgCl(s) (white precipitate) Sulfate SO42-(aq) + Ba2+(aq)D BaSO4(s) (white precipitate)
Identification of Anions Phosphate ammonium molybdate reagent 12(NH4)2MoO4 + PO43- + 3H+ (NH4)3PO4.12MoO3(s) + 12H2O + 21NH3 ammonium phosphomolybdate (yellow precipitate on heating)
3.3.2 gather, process and present information to describe and explain evidence for the need to monitor levels of one of the above ions in substances used in society
SPECTROSCOPY white light
SPECTROSCOPY • many substances can be heated to a point at which they will emit electromagnetic radiation • excitation of the atoms forces electrons to higher energy levelsg “excited state” • movement of the electron to a lower energy level requires the loss of a specific amount of energycorresponding to that transition • the excited atom can emit this energy as visible, IR or UV radiation
Spectrum Excited State n=4 UV Excited State n=3 Excited State unstable and drops back down Vi s ible Excited State But only as far as n = 2 this time n=2 • Energy released as a photon • Frequency proportional to energy drop IR n=1 Ground State
Flame Emission • electron normally in Ground State • energy supplied [ as heat or electricity] • electron jumps to higher energy level • now in Excited State - UNSTABLE • drops back to a lower level • energy that was absorbed to make the jump up is now released as a photon
EMISSION SPECTRUM • each element has unique atoms so emits an emission spectrum with a unique patternof colours (wavelengths)
EMISSION SPECTRA H Hg Ne Each element has auniqueemission spectrum
ABSORPTION SPECTRUM • when an unexcited substance is exposed to a source of radiation containing the full range of wavelengths is will absorb specificcharacteristic wavelengths corresponding to the electron transitionsto “excited” states
ABSORPTION SPECTRUM • if the light is analysed after it passes through the substance it will show gapscorresponding to the absorbed wavelengthsforming an absorption spectrum • Absorption Spectroscopy is the study of substances by analysing their absorption of specific wavelengths of radiation H
EMISSION AND ABSORPTION Hydrogen emission spectrum Hydrogen absorption spectrum
SUBSECTION 3Manufactured products, including food, drugs and household chemicals, are analysed to determine or ensure their chemical composition
3.2.2describe the use of AAS in detecting concentrations of metal ions in solutions and assess its impact on scientific understanding of the effects of trace elements