Download
1 / 20
200 likes | 321 Vues
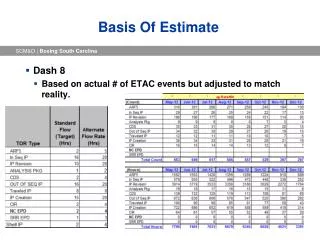
An Estimate of the Terrestrial Influx of Large Meteoroids from Infrasonic Measurements. Elizabeth A. Silber, Douglas O. ReVelle, Wayne N. Edwards, Peter G. Brown The University of Western Ontario Presented at the Bermuda Infrasound Technology Workshop, November 3-7, 2008. Agenda.

E N D
An Estimate of the Terrestrial Influx of Large Meteoroids from Infrasonic Measurements Elizabeth A. Silber, Douglas O. ReVelle, Wayne N. Edwards, Peter G. Brown The University of Western Ontario Presented at the Bermuda Infrasound Technology Workshop, November 3-7, 2008
Agenda • Introduction & Overview • Previous infrasonic influx estimates (AFTAC) • Method • Results • Summary and conclusions
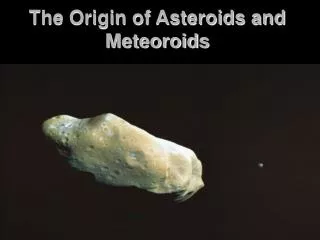
Global NEO Influx Rate • Flux of meter-sized and larger meteoroids still inadequately understood • Why do we care about influx rate? • Meter sized and larger objects can penetrate the atmosphere and produce craters • Critical to dating of young planetary surfaces • Helps quantify the risk of small asteroid impact with Earth • Constrains models of asteroid evolution • Confirms idea that most meter-to-hundred meter sized NEOs are asteroidal (not cometary) • Influx rate estimates come from a variety of sources: • Lunar cratering record (Werner et al., 2001) • Lunar Impact-flash record (Ortiz et al., 2007) • Infrasonic pressure sensor arrays (ReVelle, 1997) • US DoD Satellites (Brown et al., 2002) • Ground-based photographic fireball networks (Halliday et al., 1996)
InfrasoundCourtesy of Dr. D. Christie, ANU (ReVelle et al., 2007)
The Historic AFTAC Dataset • Global network of ground-based arrays looking for nuclear events • Operated from ~1960 to August 1974 • Microbarometer pressure sensors placed 6-12 km apart at 16-25 locations worldwide • Low and high frequency bands, each with its own frequency response filter, 440 – 44 s and 25 s – 8.2 Hz, respectively • Various sources detected (volcanic eruptions, earthquakes, aurora, bolides, etc.) • Ten bolide events detected – most of them were also verified by other methods (seismic, etc.) • Events range from 0.2 kt up to 1,100 kt (S. African bolide) • The S. African bolide is very significant
Cumulative (Integral) Influx Rate • The most comprehensive estimate to date examined satellite data (Brown et al., 2002) • Various flux estimates differ in results and assumptions – another independent study would be very valuable S. African bolide
Previous Infrasonic NEO Influx Estimates • Shoemaker & Lowery (1968), Gault (1970): AFTAC infrasound data • “Airwave” objects (Revelstoke, etc.) - First recognition that AFTAC large events were bolides • Abstracts ONLY!!!! No details of analysis procedures… • Wetherill and ReVelle (1978): • Entire AFTAC bolide infrasound database • Ten very large events over a ~14 year period- Global data set: 0.2 kt to 1.1 Mt; • All bolide data confirmed by at least one other technique. The entire technique was discussed in a Carnegie Institution of Washington (CIW) Annual Report (DTM- Department of Terrestrial Magnetism). • ReVelle (1980, 1995 -1997): • Careful reanalysis of the entire historic, infrasonic bolide data • Examined percent coverage during summer/winter, source energy for each event (average versus individual values), etc. • First “real” published estimate
Influx Calculations (ReVelle, 1997) • Given the following inputs: • Source energy (from the AFTAC empirical relationship, etc.) • Percent coverage of the Earth as a function of source energy and season, i.e., the relative detection probability of each bolide event. • Total time of operation of the infrasonic network • Cumulative bolide source energy prediction: • ∑N = Cumulative (integral) number of bolides at any source energy, ES • AE = Surface area of the Earth • Percent coverage of the AFTAC global network = f(ES, season)•AE, where f is known from a large database of explosive events for nuclear explosions of comparable source energy • ∆tO = Time of operation of the infrasonic network • N(ES) = ∑ N•{1/[f(ES, season)•AE]}•{1/∆tO} • N(ES) = Cumulative number of bolides/(over the Earth per unit time) as a function of the deduced source energy
Estimating Source Energies for Fireballs • Source E estimates typically rely on empirical relations derived from known datasets • AFTAC – originally derived for nuclear explosions (ReVelle, 1978) • log (E/2) = 3.34 log (P) – 2.58 E/2 ≤ 100 kt • log (E/2) = 4.14 log (P) – 3.61 E/2 ≥ 40 kt • Empirical Infrasound amplitude/range relation (Edwards et al., 2006) • E = 103(a-kv)/b R3 A-3/b • We used all of these approaches to derive energies
Method • Complete hardcopy dataset carefully digitized • Applied correction to the original cylindrical pen recordings to transform the to linear quantities • Applied instrument response to the airwave signals • Re-measured all quantities (raw digitized and modified digitized) • Apply wind fields After Before
Method • Below: Corrections applied for the band-pass filter as given in Flores and Vega, JASA, 1975 • Right: Infrasonic probability of detection as a function of yield and the season (AFTAC)
Examples Before: After:
More Examples The S. African bolide waveform (JB)
Preliminary Results • Had to use ‘no-wind’ relations • E averaged across stations for multi-station events • AFTAC scaled => all events are scaled to the ‘benchmark’ event (confirmed by other reliable methods, 03-Jan-65) • The S. African bolide remains a high energy event
Cumulative Influx Rate:AFTAC (modified) AFTAC modified AFTAC (ReVelle, 1997)
Cumulative Influx Rate:AFTAC (modified & scaled) AFTAC modified & scaled AFTAC (ReVelle, 1997)
Cumulative Influx Rate:Empirical relation (amplitude/range, no winds, < 7 kt) Empirical, < 7 kt AFTAC (ReVelle, 1997)
Cumulative Influx Rate:Empirical relation (amplitude/range, no winds, > 7 kt) Empirical, > 7 kt AFTAC (ReVelle, 1997)
Cumulative (Integral) Influx Rate: Multiple Approaches • Cumulative influx curve showing data from: • - a global debiasing of all telescopic surveys [Harris, 2008], • individual detailed debiased flux values from the Spacewatch and NEAT programs [Rabinowitz et al., 2000]. • lunar cratering data [Werner et al., 2002] • satellite observations [Brown et al. 2002] • the power law fit and extrapolation • The NASA 2003 NEO SDT estimated flux [Stokes et al., 2003]. • Our two new sets of data points from the digitized historic bolide data set using: • i) the AFTAC energy-period relation [ReVelle, 1997], and • ii) the empirical E > 7 kt relation [Edwards et al., 2006]
Discussion & Conclusions • Various empirical relations used to determine source energies • Some multi-station events show variations in measured energy estimates • These variations could be contributed to the shockwave originating from different locations along the trajectory trail • Wind field could not be reliably applied (standard deviations are higher than measurement itself) • The S. African event is still very energetic (0.7 – 2 Mt) • Previous and new AFTAC measurements are in agreement within a factor • Amplitude/range relation generally shows a significant divergence from previous and new AFTAC energy estimates