Image Separation Using Weighted Map and Correction with Markov Random Fields
260 likes | 375 Vues
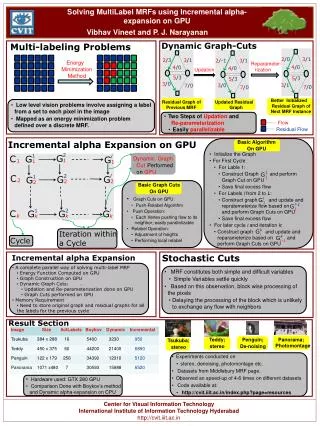
This research presents a method for separating shading and reflectance images by creating a weighted map and applying correction using Markov Random Fields. The approach involves classifying image derivatives based on their causes and magnitude differences, enabling accurate separation for various applications.

Image Separation Using Weighted Map and Correction with Markov Random Fields
E N D
Presentation Transcript
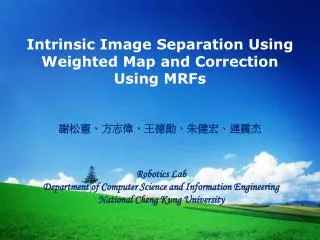
Intrinsic Image Separation Using Weighted Map and Correction Using MRFs 謝松憲、方志偉、王德勛、朱健宏、連震杰 Robotics Lab Department of Computer Science and Information Engineering National Cheng Kung University
1. Introduction(1/2) • Motivation • Why separating Shading images and Reflectance images? • Reflectance images are more appropriate for pattern recognition, object detection and scene interpretation. • Shading images can be used for shading analysis, illumination assessment.
1.Introduction(2/2) • Image decomposition • A image can be decomposed into Shading and Reflectance images like : = I(x,y) = S(x,y) R(x,y) log I(x,y) = log S(x,y) log R(x,y) Input Shading Reflectance H.G. Barrow and J.M. Tenenbaum, “Recovering Intrinsic Scene Characteristics from Images,” Computer Vision System, A. Hanson and E. Riseman, eds., pp. 3-26. Academic Press, 1978.
Assumption • Our approach • Classify image derivatives • Each derivative is caused either by shading or reflectance ,but not both. • Derivatives caused by reflectance changes have a greater magnitude than those caused by shading. Y. Weiss, “Deriving Intrinsic Images from Image Sequences,” Proc. Int’l Conf. Computer Vision, 2001.
Color Domain Transformation into LUM-RG-BY Derivative Component Image Weighted Map Derivative Component Correction Based on Probability 2.System Flowchart Module 2: Weighted-Map Creation and Derivative Component Classification Module 1: Intrinsic Derivative Component Creation Input color Image Logarithmic Transformation Derivative Component Image Classification Using Weighted Map c Module 3: Misclassification Correction Using MRFs and Loopy Belief Propagation Intrinsic Derivative Component Creation Misclassification Correction Module 4: Intrinsic Image Recovery c Deconvolution Logarithmic Intrinsic Component Image Intrinsic Images Exponential transform
2.1 Module 1:Intrinsic Derivative Component Creation(1/2) • Logarithmic transformation R G B log R log G log B
2.1 Module 1:Intrinsic Derivative Component Creation(2/2) • Derivative convolution Horizontal derivative Vertical derivative
2.2 Intrinsic Derivative Component Creation Module 1. Derivative components Classified result Module 2&Module 3 Intrinsic Derivative Component Creation i.e. for horizontal direction
2.3 Module 4:Intrinsic Image Recovery Process • Deconvolution • Exponential transform • Composition where Y. Weiss, “Deriving Intrinsic Images from Image Sequences,” Proc. Int’l Conf. Computer Vision, 2001.
3.1 Module 2:Part A:Color Domain Transformation • LUM,RG,BY color space Shading component Shading component:only in LUM image plane!! LUM RG BY • Reflectance component:in all three image planes Kingdom, F. A. A., Rangwala, S.& Hammmamji, “Chromatic Properties of the Color Shading Effect,” Vision Research, 45, 1425-1437, 2005
3.3 Module 2: Part C:Weighted-Map Classification(1/2) • Reflectance-related map • Idea:extract reflectance component • Weighted-map
3.3 Module 2: Part C:Weighted-Map Classification(2/2) Threshold & classification ;
3.4 Experimental Results(1/2) • Intrinsic images Input image Shading image Reflectance image
3.4 Experimental Results(2/2) • Intrinsic images Input image Shading image Reflectance image
4. Misclassification • Problem: • There are still some misclassifications after using weighted-map method. • Conclusion: • Most derivatives on each edge are correctly classified as reflectance. • A small number of pixels on the same edge may be misclassified as shading. Misclassifications!
4. Modeling Using Markov Random Fields(1/3) • Step1: where xi represents the hidden node state and yi represents the observation node state at pixel i. R R R R 1 1 1 1 R S S 1 0 0 R R 1 1 = = S R S 0 1 0 R R S 1 1 0 R R R 1 1 1 R R R 1 1 1 S R 0 1 S R R 0 1 1 R S R R 1 0 1 1
4. Modeling Using Markov Random Fields(2/3) • Step2: Initialize MRFs and define joint compatibility function. 1 1 1 1 1 0 0 1 1 0 1 0 1 1 0 1 1 1 1 1 1 1 1 1 1 0 0 1 0 1 0 1 1 1 1 1 0 1 1 1 1 1 0 1 0 Observation node 0 1 1 1 0 1 hidden node 0 0 1 1 1 0 0 1 1
4. Modeling Using Markov Random Fields(3/3) • Step 3:Maximize objective function P by adjusting all hidden node states. Original Classification 1 1 1 1 1 1 1 Original MRFs 1 1 1 1 1 1 1 Adjusting all hidden node states is time consuming. Use Loopy Belief Propagation to get a approximation solution. 1 1 1 1 1 1 1 1 0 1 0 0 0 1 1 1 1 1 1 1 1 1 1 1 1 1 1 1 0 0 1 1 1 0 1 1 Misclassification Correction 1 0 1 1 0 0 1 1 0 1 0 1 1 1 1 0 0 1 1 0 1 1 0 0 1 0 1 1 1 1 MRFs after maximizing P 1 1 1 0 1 0 1 1 1 1
5. Experimental Results(1/3) Misclassification Correction No Misclassification Correction
5. Experimental Results(2/3) Input image Shading image Reflectance image
5. Experimental Results (3/3) Tappen’s Result Our Result Input image Tappen’s Result Our Result Input image M.F. Tappen, W.T. Freeman, and E.H. Adelson, “Recovering Intrinsic Images from a Single Image,” IEEE Trans. on Pattern Analysis and Machine Intelligence, Vol. 27, No. 9, pp. 1459-1472, 2005.
Appendix • J.S. Yedidia, W.T. Freeman, and Y. Weiss, “Understanding Belief Propagation and its Generalizations,” MITSUBISHI Electric Research Lab, TR-2001-22, 2002
1.Introduction(1/3) • The Goal • A image is composed of two parts, called Shading and Reflectance images. We proposed a method for separating Shading and Reflectance images given a single input image. • Definition • What are Shading and Reflectance? • Reflectance: Remain constant under different illumination conditions. • Shading: Vary from different illumination conditions. 25 H.G. Barrow and J.M. Tenenbaum, “Recovering Intrinsic Scene Characteristics from Images,” Computer Vision System, A. Hanson and E. Riseman, eds., pp. 3-26. Academic Press, 1978.
3. Weighted-Map Method: Flowchart Part A: Color Domain Transformation LMS Image Input image I RG BY LUM Derivative filters convolution Part B: Filter Convolution |max| |max| Reflectance-related Map Reflectance-related Map | | | | Part C: Weighted-Map Classification Weighted- map Weighted-map Threshold & Classification 26