Download
1 / 57
570 likes | 728 Vues
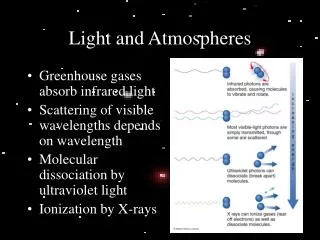
Effects of heat and modified atmospheres on insects. Lisa G. Neven USDA-ARS Yakima Agricultural Research Laboratory Wapato, WA. Heat Treatments For Fresh Commodities. Types of Treatments Hot Water (Dips, drenches, or sprays) Vapor Heat Hot Forced Air (non-condensing) Microwaves

E N D
Effects of heat and modified atmospheres on insects Lisa G. Neven USDA-ARS Yakima Agricultural Research Laboratory Wapato, WA
Heat TreatmentsFor Fresh Commodities • Types of Treatments • Hot Water (Dips, drenches, or sprays) • Vapor Heat • Hot Forced Air (non-condensing) • Microwaves • Radio Frequency • Types of Responses • Metabolism • Respiration • Nervous System • Endocrine • Heat Shock Proteins
Heating Media at 48°C 50 48 46 Temperature at and 2mm below fruit surface 44 Surface: Vapor-pressure-deficit, forced-air Below surface Surface: Vapor-saturated, forced-air 42 Below surface Surface: Hot water Below surface 40 0 10 20 30 40 50 60 70 80 90 100 110 120 Time (min) K. Shellie, USDA-ARS
915 MHz 2450 MHz Microwaves 27.12 MHz Radio waves Infrared Utra violet Electromagnetic Energy • Is it heat? • Is it radiation? • Is it something else? (dielectric effect)
Heat Diffusion Radio Frequency Conduction Object Object Comparison of Thermal and Radio Frequency Treatments Heat Source Source James Hansen, USDA-ARS, USA
Radio Frequency Treatments • See a higher level of mortality over that which can be explained by thermal mortality. • It appears to be part thermal and part dielectric effects on mortality.
Temperature profiles of walnut kernels and codling moth slurry when subjected to 27 MHz RF system (S. Wang and J. Tang, WSU)
Microwave Treatments • Appears to be very effective in treatment of insects in dry commodities. • Insects heat faster due to water content. • Some limited success in fresh produce. • Mortality still an effect of heating.
Terminology of Temperature Change • Step Function: refers to a change from one temperature to another as rapidly as possible • Step-function transfers reveal how rapidly an insect can respond to a thermal challenge. • Example: water bath studies in which insects are immersed directly into heated water (or other aqueous medium) (Sharp and Chew 1987, Jang 1991) (Clarke 1967)
Terminology of Temperature Change • Ramp Function: is when a slower rate of change in temperature occurs • Ramp-function heat treatments can reveal, through examination of the response curve, what mechanisms may be involved in thermal tolerance and indicate whether the tolerance limits of the insect is wider in response to a ramp than to a step function. • Example: In-fruit heat treatments or controlled water bath treatments (Shellie 1997, Neven 1998a,b) (Clarke 1967)
Important Factors Affecting Heat Treatments • Temperature of treatment • Insect thermal limits • Rate of heating • Acclimation vs. acclimatization • Duration of heat treatment • Range from sub-lethal to lethal responses • Insect Milieu • Location in commodity • Physical state of commodity surrounding insect
Velocity (T° + 10°) Q10 = Velocity (T°) ( ) 10/ (T°2 – T°1) k2 k1 Q10 = Q10 Effects OR
1.2 1.0 AT 10°C AT 20°C 0.8 AT 30°C 0.6 0.4 0.2 0 -0.2 -0.4 320 330 340 350 360 5 10 / T K ET °C Arrhenius plots of PK activity from muscle and fat body of Acheta domesticus after periods at various acclimation temperatures. (After Hoffman and Marstatt 1977).
TemperatureEffectson Metabolism 14 12 10 8 6 Heat Rate uW/mg 4 2 0 10 20 30 Temperature °C
40 Where... b0 = 22.4462 + 1.0486 SE b1 = -1.5745 + 0.09844 SE b2 = -0.2970 + 0.02339 SE R2 = 0.972 30 Time at Final Temp. (Hr) 20 10 0 0.06 0.08 0.1 0.12 0.14 0.16 0.18 0.2 Heat Rate 42 44 46 Time at Final Temperature versus Heating Rate ln(LT95) = b0 + b1ln(heat rate) + b2 (treatment temperature)
VAPOR 48°C 4 50 45 3 ul CO2/mg/min 40 TEMPERATURE °C MOIST 48°C 2 35 4 50 45 30 3 40 1 ul CO2/mg/min TEMPERATURE °C 25 2 35 30 1 0 20 25 0 50 100 150 200 250 300 0 20 0 50 100 150 200 250 300 TIME (min) TIME (min) Respiratory Response to Heat Treatment • Fifth instar codling moth CO2 production during a simulated heat treatment of apple • Note characteristic peak followed by rapid decline in CO2 production.
Codling Moth Pupal Respiration 0.06 Whole Range 0.05 uL O2/mg/min = 0.001533 X Temp -0.00809 R2 = 0.977207 0.04 ul CO2/mg/min 0.03 0.02 10-30°C Range uL O2/mg/min = 0.001942 X Temp -0.01618 0.01 R2 = 0.998422 0 5 10 15 20 25 30 35 40 Temperature °C
1.4 1.2 1 0.8 uLCO2/mg/min 0.6 0.4 10 15 20 25 30 TEMPERATURE °C Linear Fit RESP Respiration of fifth instar codling moth at constant temperature
Omnivorous Leafroller Pupal Respiration 0.09 0.07 uL CO2/mg/min 0.05 0.03 0.01 0 10 20 30 40 50 Temperature °C
Effect of temperature cycling on the metabolic heat rate at 20 C of green peach aphids (M. persicae), expressed as a percentage of the original value, as a function of the stress temperature and number of cycles to the stress temperature. From: Downes et al. 2003.
41.5°C August 12 41.3°C 42.0 37.0 32.0 Temperature °C 27.0 22.0 17.0 12.0 1:35 3:05 4:35 6:05 7:35 9:09 1:39 3:09 4:39 6:09 7:39 9:09 12:05 10:39 12:09 10:39 12:09 Time air deep shallow deep Apple Temperatures During a Typical Summers’ Day
120 C1 100 C2 90 Temperature °F C3 80 70 C4 60 12:00:00 AM 12:00:00 AM 12:00:00 AM 12:00:00 AM 12:00:00 AM Time Peach Fruit Temperatures on the tree 110
MODELS OF THERMAL DAMAGE • Roti Roti (1982) suggests that the effects of heat on macromolecules is the critical element of thermal damage. • Bowler (1987) points to damage of the cell membrane as the critical event.
THERMAL DAMAGE: It’s a matter of Degrees Macromolecules Cells Increasing Resistance to Heat Damage Tissues Whole Organism (most sensitive)
HEAT SHOCK PROTEINS • Heat shock proteins are classified as to the molecular weight on SDS-PAGE. • General classes: • low molecular weight 20-30 kDa • HSP70’s—Most common in insects • HSP90’s • HSP >100 kDa
Denatured Renatured DnaK DnaJ GrpE + + GroEL GroES Folding Complex <Association/Dissociation> HEAT SHOCKPROTEINS Spontaneous Facilitated
Heat Rate and HSP’s • Thomas & Shellie 2000 described a reduction in the percent of Mexfly larvae expressing a HSP28 in relation to the rate of heating. • The more rapid the rate of heating, the lower the percentage of the larvae expressing this HSP.
Heat Shock Proteins and Anoxia • The production of heat shock proteins in insects is inhibited under anoxic conditions. (Yocum & Denlinger 1994).
Temperature Time CA Atmosphere Types of CA Treatments • Low Temperature CA: • 0-15°C, 0-5% O2, 0-10% CO2. Long duration. • High Temperature CA: • 20-50°C, 0-5% O2, 0-60% CO2. Short duration. • MAP (Modified Atmosphere Packaging): • 0-20°C, 1-18% O2, 0-10% CO2. Long Duration • Film Wraps: • 20-27°C, variable ATM, long duration. • Coatings: • 0-50°C, variable ATM, short or long duration. ?!? • Hot Water Dips: • 42-55°C, 1-10% O2, 0-10% CO2. Short Duration.
Temperature Time CA Atmosphere Coating or Film?
Isothermal Heat Doses 22 20 18 16 14 12 10 8 6 4 2 0 0 1 2 3 4 5 6 Carbon Dioxide Oxygen 28 24 20 Concentration inside fruit (kPa) 16 12 8 4 0 0 1 2 3 4 5 6 Hot air Time (h) Hot 1 kPa O +20 kPa CO 2 2 K. Shellie, USDA-ARS Hot water
Temperature Time CA Atmosphere CA Mode of Action on Insects • >10% CO2 stops production of NADPH which aids in detoxification • Energy charge is reduced, slowing processes requiring ATP. • Production of glutathione (used in MeBr detoxification) is reduced. • High CO2 inhibit regeneration of choline to acetylcholine. Friedlander 1983.
Temperature Time CA Atmosphere CA and Metabolic Heat Rate • Decrease in heat rate with decreasing O2. • Critical O2 levels (Pc) increased with temp. • Metabolic heat rate decreased rapidly at 20% CO2, but little change up to 79%. • Additive effects realized at <5% CO2 and >4% O2. • High susceptibility to CO2 at high temps. related to high metabolic heat rates. • Low O2 response correlated to metabolic arrest and anaerobic metabolism. Zhou et al. 2000
Temperature Time CA Atmosphere CA and Metabolic Response • Decrease in MHR with increasing CO2 and decreasing O2. • Recovery by pupae when MHR reduced by 30%. • MHR decrease by 50% resulted in death. • Mortality equivalent between 5% CO2 and 6% O2, and 10% CO2 and 2% O2. • Effects of low O2 and elevated CO2 on membrane permeability. Zhou et al. 2001
Temperature Time CA Atmosphere 100 80 60 % Decrease in MHR 40 20 0 5 10 20 40 79 6 2 1 0 %CO2 %O2 % Decrease in Metabolic Heat Rate Platyona stultana pupae Zhou et al. 2001
Temperature Time CA Atmosphere 100 80 10C 60 % Decrease 20C 40 30C 20 0 0 5 10 20 40 80 % Carbon Dioxide % Decrease of Metabolic Rate of Codling Moth Pupae Under Varying Temperatures and Concentrations of Carbon Dioxide
Temperature Time CA Atmosphere 100 80 60 % decrease 40 20 0 0 2 4 6 8 10 %O2 % Decrease of Metabolic Rate of Codling Moth Pupae Under Varying Concentrations of Oxygen
Metabolic heat rate at 20 °C of a codling moth (C. pomonella) pupa, fresh mass 0.0400 g, in air and in a controlled atmosphere of 60% CO2 + N2. From: Downes et al. 2003.
Response of green peach aphids (M. persicae) to anoxic atmospheres at 20°C, plotted as percent recovery of the initial metabolic heat rate in air, versus the time in the anoxic atmosphere. Downes et al. 2003.
Temperature Time CA Atmosphere Controlled Atmosphere Temperature Treatment System CATTS Controls & Monitors: O2, CO2, Air Speed, Humidity, Dew Point, Air Temperatures, Heat Rate, Fruit Temperatures (surface & core)
Combined Effects of Oxygen and Carbon Dioxide Levels • To determine the critical levels of O2 and CO2 needed to make a heat treatment most effective. • Used optimized CATTS treatment times of 45 min for 45°C and 25 min for 47°C (at 1%O2 and 15%CO2) as end points. • 5 Levels of CO2 and 6 levels of O2. • 50 larvae per time point per rep. (4 reps).
45°C, 20 min3rd instar codling moth in sweet cherries 100 80 % Corr. Mort. 60 40 20 0 5 0 10 0.5 15 1 % CO2 6 11 20 16 20 % O2
45°C, 30 min3rd instar codling moth in sweet cherries 100 80 % Corr. Mort. 60 40 20 0 5 0 10 0.5 % CO2 15 1 6 11 20 16 % O2 20
45°C, 40 min3rd instar codling moth in sweet cherries 100 80 % Corr. Mort. 60 40 20 0 5 10 0.5 15 1 % CO2 6 11 20 16 20 % O2
47°C, 10 min3rd instar codling moth in sweet cherries 100 80 % Corr. Mort. 60 40 20 0 5 0 10 0.5 % CO2 15 1 6 11 20 16 % O2 20
47°C, 15 min3rd instar codling moth in sweet cherries 100 80 60 % Corr. Mort. 40 20 0 5 0 10 0.5 15 1 % CO2 6 11 20 16 20 % O2