Download
1 / 23
230 likes | 344 Vues
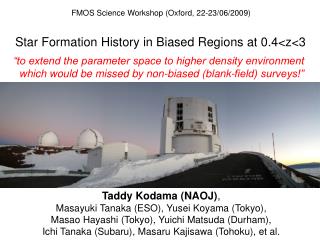
FMOS Science Workshop (Oxford, 22-23/06/2009). Star Formation History in Biased Regions at 0.4<z<3. “to extend the parameter space to higher density environment which would be missed by non-biased (blank-field) surveys!”.

E N D
FMOS Science Workshop (Oxford, 22-23/06/2009) Star Formation History in Biased Regions at 0.4<z<3 “to extend the parameter space to higher density environment which would be missed by non-biased (blank-field) surveys!” Taddy Kodama (NAOJ), Masayuki Tanaka (ESO), Yusei Koyama (Tokyo), Masao Hayashi (Tokyo), Yuichi Matsuda (Durham), Ichi Tanaka (Subaru), Masaru Kajisawa (Tohoku), et al.
Origin of Environmental Dependence N-body simulation of a massive cluster z = 30 z = 5 (Yahagi+05) z = 3 z = 2 MOIRCS (NIR) 4’×7’ Nature? (intrinsic) Need to go higher redshifts because it becomes more evident. Nurture? (external) Need to go outer infall regions to see directly what’s happening there. Nature? (intrinsic) earlier galaxy formation and evolution in high density regions Nurture? (external) galaxy-galaxy interaction/mergers, gas-stripping Suprime-Cam (Opt) 34’×27’ z = 1 z = 0 FMOS (NIR-spec) 30’φ M=6×10¹⁴ M◎ 20×20Mpc2 (co-moving)
Panoramic Imaging and Spectroscopy ofCluster Evolution with Subaru ~10 X-ray detected clusters at 0.4 < z < 1.45 ( ) ( ) ,NB ( ) ( ) ( ) ACS(3.5’) ( ) 1.14 XMM (XMMU2235.3-2557)223520.6 -255742.0 1.39 3.0 VRi’z’ XMMJ2215.9-1738 221558.5 -173802.5 1.45 4.4 VRi’z’,NB XMM z~1.4 XMM Kodama et al. (2005)
Highredshift(z)RadioGalaxies[HzRG] with Subaru, VLT, and Spitzer 7 confirmed proto-clusters at 2 < z < 5.2 associated to radio galaxies Overdense regions in Lyman-α emitters by a factor of 3—5. Name redshift NIR Spitzer Lya spectra others PKS 1138-262 2.16 JHKs 3.6--8.0 16 NIR/Opt Ha, VLA, Chandra, SCUBA 4C 23.56 2.48 JHKs 3.6--8.0 NIR Ha USS 1558-003 2.53 JHKs 3.6--8.0 USS 0943-242 2.92 JHKs 3.6--24.0 29 NIR/Opt MRC 0316-257 3.13 JHKs 3.6--8.0 32 NIR TNJ 1338-1942 4.11 JHKs 3.6--8.0 37 Suprime-Cam, VLA, MAMBO TNJ 0924-2201 5.19 JHKs 3.6--24.0 6 Suprime-Cam/ACS (LBGs) Primarily using MOIRCS/Subaru and Hawk-I/VLT Kodama et al. (2007), De Breuck et al. (Spitzer HzRGs)
A Huge Cosmic Web at z=0.5 over 50 Mpc (80’x80’ by 7 S-Cam ptgs.) CL0016 cluster (z=0.55) FMOS FoV’s Millenium Simulation (Springel et al. 2005) ~1200 redshifts! Dots: red sequence galaxies in V-I Red: spectroscopically confirmed members Blue: spectroscopically confirmed non-members (Tanaka, et al., in prep.)
LSS around CL 1252-2927 (z=1.24) Tanaka, et al. (submitted) z=1.24 z=1.24 z=1.24 30 Mpc (comoving) z=1.24 27 arcmin z=1.17 z=1.17? FMOS FoV Subaru/Suprime-Cam (V,R,I’,z’) + UKIRT/WFCAM (K’) + VLT/FORS2 (spectroscopy)
AKARI 15um (rest 7-8um) high med low Sharp colour transition in groups/outskirts 銀河の色は中間的な環境で急激に変化する RXJ1716 cluster (z=0.81) AKARI FOVs (赤い銀河の割合) high ~ cluster core med ~ group / filament low ~ field Koyama, TK,et al. (2008)
A narrow-bandHα imaging with MOIRCS/Subaru RXJ1716 cluster (z=0.813) J ~ 30min (23.1 mag, AB, 5σ) continuum NB119 ~ 100min (22.7 mag, AB, 5σ) Hα emission NB119 J AKARI FOVs Ha emission from z=0.81 galaxy MOIRCS FOV NB119 resp. func. spec-z distribution (Gioia+ 99) ○:15mmsources Koyama, TK,et al. (2009)
Chandra X-ray map (Jeltema+05) Spatial Distribution of the 15μm sources and Hα emitters MOIRCS FoVs Void ! : all member : : Ha emitter : 15um source Koyama, TK,et al. (2009)
Some Hαemitters on/near the RS Many 15μm sourceson/near the RS Especially in the medium density regions! MIR galaxies are dusty and ‘not’ detected as strong Ha emitters Lots of SF is hidden in the red sequence, especially in the medium density regions!
Interacting galaxies in the 15μm sources Subaru(z’) AKARI(L15) Koyama, TK, et al. (2008)
A narrow-band [OII] imaging with Suprime-Cam/Subaru (XCS2215@z=1.457) Hayashi et al. (2009), in prep. XMMXCS J2215.9-1738 [OII] @ z=1.46 z’ ↓ NB912 NB912 filter (lc=9139A, Dl=134A) (Stanford+06 )
Spatial Distribution of the [OII] emitters XCS2215@z=1.457 High star formation activity to the very centre of the cluster! Hayashi et al. (2009), in prep.
Star forming activity in the cluster cores Hαemitters at z=0.81 (RXJ1716) [OII]emitters at z=1.46 (XCS2215) □ □ phot-z members ● Koyama, TK, et al. (2009) Hayashi, TK, et al. (2009) Inside-out propagation of star forming activity in cluster cores !?
Emergence of the red-sequence at z~2 in proto-clusters? z~2(PKS1138) z~3(USS0943) ● DRG(J-K>2.3) ● r-JHK ● b-JHK RG Kodama et al. (2007) The red sequence seems to be emerging between z=3 and 2 ( 2 < Tuniv[Gyr] < 3).
Working hypotheses • Starbursts/truncation of galaxies in groups/ outskirts of clusters at z<1 External effects(“Nurture”) (galaxy-galaxy interaction?) • Formation of massive galaxies in cluster cores at z>1.5-2 Intrinsic effects (“Nature”) (galaxy formation bias?) “Inside-out propagation/truncation of star formation in clusters?”
FMOS Windows (0.9<λ[μm]<1.8) • Hα (6563Å) :0.4 <z< 1.7 (excl. 1.05 ~1.2) • [OII](3727Å) : 1.4 <z< 3.8 (excl. 2.6 ~ 2.9) • [OIII](5007Å) :0.8 <z< 2.6 (excl. 1.7 ~ 1.9) • Hβ (4861Å) : 0.85<z< 2.7 (excl. 1.77 ~ 2) 30’ = 30Mpc (z=1), 50Mpc (z=2) SFR, chemical abundance, dynamical mass of SF galaxies at 0.4<z<3.8 and their environmental dependence
<SFR>=SFR/M* versus M* as functions of Redshift and Environment 114 Hα emitters at z~2 Erb et al. (2006) Erb et al. (2006) SFR (Hα) / Mstar With FMOS, we can correct for dust extinction with Hβ/Hα for 0.85<z<1.7
Mdyn vs. Mstars Mstar ≪Mdyn log Mdyn Mstars / Mdynratios indicate evolutionary stages of galaxies! log Mstars Galaxies with Mstars ≪ Mdyn tend to have younger ages and stronger Hα emission. Erb et al. (2006)
Gaseous Metallicity of Distant Galaxies [NII] / Hα vs. [O/H] Kobulnicky & Kewley (2004) We can apply both techniques at 1.4<z<1.7 with FMOS and break the degeneracy between Z (metallicity) and q (ionization parameter)
Chemical Evolution vs. Star Formation History GDDS+VFRS, Savaglio et al. (2005) z~2, Erb et al. (2006) sBzK(z~2) SDSS(z=0) SDSS(z=0) 12+log(O/H) z~2 z~0.7 log Mstar Chemical Evolution Star Formation History Zg = -y(1-Reject) ln(fg) Feedback (outflow) as a func of mass !
Target List and Requested Time 5 (~10) mid-z clusters at 0.4<z<1.5, and 3 (~6) proto-clusters at 2<z<3 Including overheads (30%?), we request 103hrs (=10nights) for the primary targets and 82.2 hrs (=8nights) for the secondary targets.
FIT-PISCES(FMOSInTensive PISCES) FMOS will nicely FIT in our on-going PISCES project! *Mapping 3-D large scale structures (~400/FoV) *Environmental dependence of SFH (Hα ~ 1-2 M◎/yr @z<1.5, [OII] ~ 10-30 M◎/yr @z>2) Star formation rate (Hα, [OII] emission lines) Dust extinction (Hα/Hβ) Post-starburst (composite Balmer absorption lines) Dynamical mass (line width) Metallicity,AGN separation([OII], [OIII], Hα/β, [NII]) “When and Where do we see (post-)starbursts and truncation?” “How much star formation is hidden in the optical (rest-UV) surveys?”