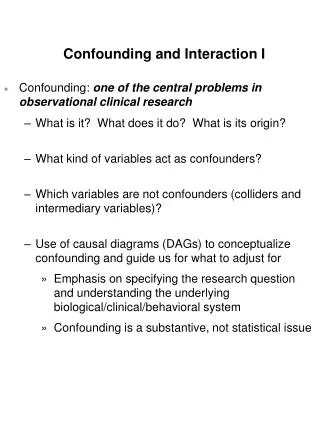
Effect Modification & Confounding
Effect Modification & Confounding. Kostas Danis EPIET Introductory course, Menorca 2012. Analytical epidemiology. Stratification - Effect modification - Confounding Matching Multivariable analysis. Study design: cohorts & case control & cross-sectional studies

Effect Modification & Confounding
E N D
Presentation Transcript
Effect Modification & Confounding Kostas Danis EPIET Introductory course, Menorca 2012
Analytical epidemiology • Stratification • - Effect modification - Confounding • Matching • Multivariable analysis Study design: cohorts & case control & cross-sectional studies Choice of a reference group Biases Impact Causal inference
Cohort study Non cases Risk % Total Cases 100 Exposed 50 50 50 % Not exposed 100 10 90 10 % Risk ratio 50% / 10% = 5
Source population Cases Exposed Sample Unexposed Controls: Sample of the denominator Representative with regard to exposure Controls
Controls are non cases Cases Low attack rate: non-cases likely to represent exposure in source pop Sourcepopn Non- cases start end High attack rate: non-cases unlikely to represent exposure in source population Cases Non- cases start end
Case control study Controls Odds ratio Cases a b Exposed OR= (a/c) / (b/d) = ad / bc Not exposed c d a+c b+d Total Odds of exposure a/c b/d
Cross-sectional study: Sampling Sample Sampling Population Target Population
Cross-sectional study Non cases Prevalence % Total Cases 1,000 Exposed 500 500 50 % Not exposed 1,000 100 900 10 % Prevalence ratio (PR) 50% / 10% = 5
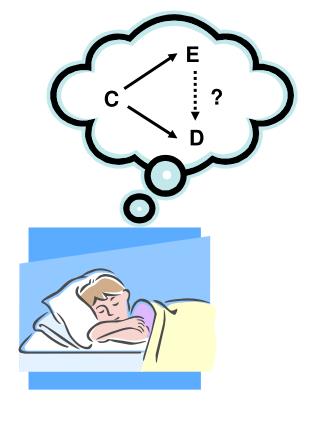
True association causal non-causal Chance? Bias? Confounding? Should I believe my measurement? Exposure Outcome RR = 4
Exposure Outcome Third variable
Two main complications (1) Effect modifier (2) Confounding factor - useful information - bias
To analyse effect modification To eliminate confounding Solution = stratification stratified analysis Create strata according to categories inside the range of values taken by third variable
Effect modifier Variation in the magnitude of measure of effect across levels of a third variable. Happens when RR or OR is different between strata (subgroups of population)
Effect modifier • To identify a subgroup with a lower or higher risk ratio • To target public health action • To study interaction between risk factors
Effect modification Effect modifier = Interaction Disease (lung cancer) Factor A (asbestos) Factor B (smoking)
Asbestos (As) and lung cancer (Ca) Case-control study, unstratified data As Ca Controls OR Yes 693 320 4.8 No 307 680 Ref. Total 1000 1000
Asbestos Lung cancer Smoking
Asbestos (As), smoking and lung cancer (Ca) As Smoking Cases Controls OR Yes Yes 517 160 8.9 Yes No 176 160 3.0 No Yes 183 340 1.5 No No 124 340 Ref. 1.5 * 3.0 < 8.9 1.5 * 3.0 * interaction=8.9
Physical Infarction activity Gender
Vaccine efficacy ARU – ARV VE = ---------------- ARU VE = 1 – RR
Vaccine efficacy VE= 1 - RR = 1 - 0.28 VE= 72%
Vaccine Disease Age
Effect modification • Different effects (RR) in different strata (age groups) • VE is modified by age • Test for homogeneity among strata (Woolf test)
Any statistical test to help us? • Breslow-Day • Woolf test • Test for trends: Chi square Homogeneity
How to conduct a stratified analysis? Crude analysis • Stratified analysis • Do stratum-specific estimates look different? • 95% CI of OR/RR do NOT overlap? • Is the Test of Homogeneity significant? YES EFFECT MODIFICATION (Report estimates by stratum) NO Check for confounding (compare crude RR/OR with MH RR/OR)
Death from diarrhea according to breast feeding, Brazil, 1980s(Crude analysis) Diarrhea Controls OR (95% CI) No breast feeding 120 136 3.6 (2.4-5.5) Breast feeding 50 204 Ref
No breast Diarhoea feeding Age
Death from diarrhea according to breast feeding, Brazil, 1980s Infants < 1 month of age Cases Controls OR (95% CI) No breast feeding 10 3 32 (6-203) Breast feeding 7 68 Ref Infants ≥ 1 month of age Cases Controls OR (95% CI) No breast feeding 110 133 2.6 (1.7-4.1) Breast feeding 43 136 Ref Woolf test (test of homogeneity):p=0.03
Risk of gastroenteritis by exposure, Outbreak X, Place, time X (crude analysis) * AR = Attack Rate † RR = Risk Ratio ‡ 95% CI = 95% confidence interval of the RR
Tuna gastroenteritis Pasta
Risk of gastroenteritis by exposure, Outbreak X, Place, time X (stratified analysis) Pasta Yes Cases Total AR (%) RR (95% CI) Tuna 43 52 83 1.1 (0.9-1.3) No tuna 46 60 77 Ref Pasta No Cases Total AR (%) RR (95% CI) Tuna 4 17 24 11 (2.6-46) No tuna 3 144 2 Ref Woolf test (test of homogeneity): p=0.0007
Tuna, pasta and gastroenteritis Tuna Pasta Cases AR(%) RR Yes Yes 43 83 42 Yes No 4 23 12 No Yes 46 76 38 No No 3 2 Ref. 38 * 12 > 42 38 * 12 * interaction= 42
Risk of HIV by injecting drug use (idu), surveillance data, Spain, 1988-2004 Cases Total AR (%) RR (95% CI) Idu 268 2,732 9.8 3.9 (3.3-4.4) No idu 484 18,822 2.5 Ref
idu hiv gender
Risk of HIV by injecting drug use (idu), Spain, 1988-2004 (stratified analysis) Males Cases Total AR (%) RR (95% CI) idu 86 693 12 20 (14-28) No idu 52 8,306 0.6 Ref Females Cases Total AR (%) RR (95% CI) idu 182 2,039 8.9 2.3 (1.9-2.6) No idu 432 10,576 4.1 Ref Woolf test (test of homogeneity): p=0.00000
Idu, gender and hiv Idu Male Cases AR(%) RR Yes Yes 86 12.4 3.0 Yes No 182 8.9 2.2 No Yes 52 0.6 0.14 No No 432 4.1 Ref. 0.14 * 2.2 > 3.0 0.14 * 2.2 * interaction= 3.0
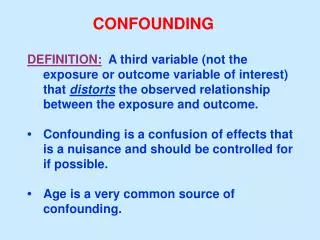
Confounding • Distortion of measure of effect because of a third factor • Should be prevented • Needs to be controlled for
Confounding Skate- boarding Chlamydia Age Age not evenly distributed between the 2 exposure groups - skate-boarders, 90% young - Non skate-boarders, 20% young
ExposureOutcome (coffee) (Lung cancer) Third variable (smoking)