Rating the Road for Vulnerable Users
Road crashes rank among the top three causes of death for individuals aged 5 to 44. The iRAP initiative focuses on improving safety for vulnerable road users such as pedestrians, cyclists, and motorcyclists through targeted risk assessments, safety plans, and ongoing performance tracking. This document outlines risk factors, safety measures, and urban planning considerations essential for enhancing road safety and decreasing fatalities in these groups. With a commitment to safer roads, we aim to implement valuable training and strategies in partnership with governments and organizations worldwide.

Rating the Road for Vulnerable Users
E N D
Presentation Transcript
Rating the Road for Vulnerable Users February 17, 2011
Road crashes are one of the top three causes of death for 5 to 44 year olds. World Health Organisation
Road deaths per 100,000 m population, 2008 IRTAD, 2009 * 2007 (p) provisional
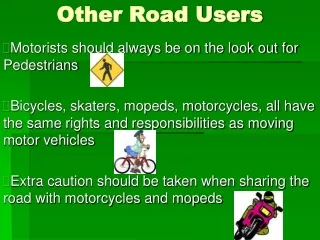
About iRAP iRAP is a not-for-profit working in partnership with government and non-government organisations to: • assess high-risk roads and create targeted safety plans • provide training, technology and support • track road safety performance
iRAP • Vulnerable Road Users: • Peds • Bikes (increasingly, electric bikes) • Motorscooter/cycles • Star Ratings concept Road Inspection Data Road Protection Scores Star Rating Road Safety Investment Plan
Sources of data • Examples: • Elvik, R. and Vaa, T. (2004) The handbook of road safety measures • Ogden, K. (1996) Safer Roads: A Guide to Road Safety Engineering.
Road users Crash types Road attributes Speed Sidewalk provision – left Sidewalk provision – right Side friction Along Pedestrians Speed Number of lanes Median type Crossing facilities Crossing facilities quality Across
Road Protection Scores Road users Crash types Road attributes Speed Roadside severity – left Roadside severity – right Lane width Paved shoulder Curvature Curve quality Delineation Road condition Facilitates for bikes Side friction Along Bicyclists Speed Crossing facilities Number of lanes Median type Crossing facilities Crossing facilities quality Across Speed Intersection type Intersecting road volume Intersection quality Minor access density Intersection
Traffic • Total traffic flow recorded in AADT • This should include all motorised vehicles • The numeric value will be entered for each 100m section
Bicycle flow High Medium Low None • 6 + bicycles per 100m • 3 to 5 bicycles per 100m • 1 to 3 bicycles per 100m • No bicycles present • Notes: • Raters should assess the general proportions of bicyclist in the flow over an extended length – and apply that for all segments along that road until an obvious change in proportions is noted.
Pedestrian flow – crossing road High Medium Low None • 6 + crossing per 100m • 3 to 5 crossing per 100m • 1 to 3 crossing per 100m • No pedestrians crossing daily • Notes: • It is acknowledged that this is a random sampling of pedestrian activity, it is not intended to reflect an exact pedestrian volume. This data should be used in association with land-use data and local knowledge to derive the pedestrian demand rating required by the iRAP model.
Pedestrian flow – along road High Medium Low None • 6 + along per 100m • 3 to 5 along per 100m • 1 to 3 along per 100m • No pedestrians along daily • Notes: • It is acknowledged that this is a random sampling of pedestrian activity, it is not intended to reflect an exact pedestrian volume. This data should be used in association with land-use data and local knowledge to derive the pedestrian demand rating required by the iRAP model.
Area type Urban Semi-urban • Urban: • continuous development > 800m. • Semi Urban: • continuous development 200m to 800m • higher speed roads on the outskirts of towns • rural roads passing through lower density development or villages Houses Houses
Area type Rural • Rural: • All other areas
Number of lanes Two Two lanes in direction of travel
Speed limit >120 km/h 110 km/h 100 km/h 90 km/h 80 km/h 70 km/h 60 km/h 50 km/h <40 km/h Notes The actual posted numerical speed limit should be recorded If no speed limit is signed, the default speed limit set by law for that type of road should be used.
Lane width Medium • Lane width is 2.75 to 3.25m 2.75 to 3.25m
Paved shoulder width 0 to 1m wide Paved shoulder is 0 to 1m 0-1m 0-1m
Unpaved shoulder width 1 to 2.4m wide Unpaved shoulder is 1 to 2.4m 1-2.4m 1-2.4m
Shoulder rumble strips Yes - present Only rumble strips that are approximately greater than 30cm in width and 5cm depth/height should be recorded.
Delineation Adequate Signs warning of severe hazards, and centre and edge markings are generally present and visible
Road Condition Poor Road has serious defects which are likely to result in frequent or unpredictable impact on vehicle control
Sidewalk – Left 1 to 3m Non-physical separation from traffic Sidewalk separated from roadway by between 1m and 3m but no barrier provided 1-3m
Sidewalk – Left Physical barrier Sidewalk separated from road by a physical barrier at least 1m high
Side Friction Medium Activities or parking on one side of the road spill out onto the road
Pedestrian crossing facilities Refuge only No crossing is marked but a central refuge is provided for pedestrians
Pedestrian crossing facilities Unsignalised marked crossing without refuge The crossing is well marked but has no central refuge
Pedestrian crossing facilities Unsignalised marked crossing with refuge The crossing is well marked and split with a central refuge
Pedestrian crossing facilities Signalised without refuge Traffic signals control pedestrian and vehicle movements
Pedestrian crossing facilities Signalised with refuge Traffic signals control pedestrian and vehicle movements; the crossing is split with a central refuge
Pedestrian crossing facilities Grade separated facility The crossing is physically separated and does not bring pedestrians into conflict with traffic
Quality of crossing Poor Rapid or unexpected speed adjustments might be needed to avoid risk to pedestrians
Facilities for bicycles None No specific provisions for bicycles
Facilities for bicycles Dedicated bicycle lane on roadway Dedicated bicycle lane separated from traffic only by lane marking on roadway or by <1m of raised or paved surface
Facilities for bicycles Segregated Bicycle path Bicycle path separated from traffic by at least 1m raised or paved surface
Facilities for bicycles Segregated Bicycle path with barrier Segregated bicycle path separated by a physical barrier or located at least 10m from the road The physical barrier must be sufficient to restrain a vehicle from entering the bicycle facility at the posted speed limit.
Roadside severity – Bike path • Cliff • Distance to object 0 to 5m • Steep embankment slope • Deep drainage ditch • Distance to object 5 to 10m • Cut • Safety barrier • Motorcycle friendly barrier • Distance to object > 10m • Notes: • Roadside severity – Segregated Bicyclist Path records the roadside when there are segregated bicycle facilities
Roadside severity - Right Cliff Cliff or equivalent hazard that will result in certain fatality regardless of speed
Roadside severity - Right Distance to object 0 to 5m • Aggressive objects within effective distance of 5m • Roadside gradient should be taken into account • Examples of hazardous objects are: • Lighting columns • Trees greater than 10cm diameter • Posts greater than 10cm diameter • Structures that cause a rapid deceleration when hit • Ramped ends of safety barriers 0-5m
Roadside severity - Right Steep embankment slope • Embankments with : • >1:3 slope & drop >5m • >1:2 slope & drop >1.5m • Rule of thumb • A slope should be recorded if a vehicle is likely to roll on it
Roadside severity - Right Deep drainage ditch Ditch of material, depth, or severity of angled face likely to result in severe injury to vehicle occupants. If the ditch does not if this criteria it should be recorded Rule of thumb Only record a ditch if most of the vehicle would drop into the ditch.
Roadside severity - Right Distance to object 5 to 10m Aggressive objects within effective distance of 5 to 10m Roadside gradient should be taken into account 5-10m
Roadside severity - Right Cut • Non-aggressive cut face of at least 2m height • Examples of cut are: • Earth bound banks • Grass banks • Rock faces should not be recorded as cut
Roadside severity - Right Safety barrier Barrier sufficient to restrain most cars and small vehicles
Roadside severity - Right Motorcycle friendly barrier Barrier designed specifically to restrain motorcycles without injury to the rider