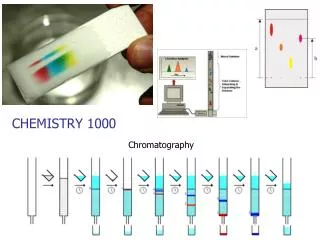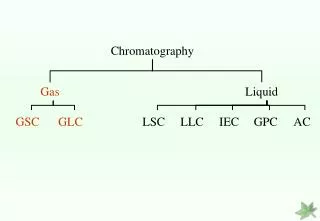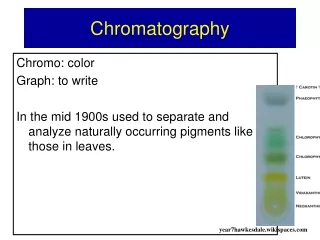
Chromatography
Chromatography. Prof. Zoltán Juvancz D.Sc. The first chromatography by Tswett. Aim of chromatography. The compounds of interest has to be separated from matrix components. The signal to noise ratio must be as high as possible. The time consumption of analysis must be short.

Chromatography
E N D
Presentation Transcript
Chromatography Prof. Zoltán Juvancz D.Sc.
Aim of chromatography • The compounds of interest has to be separated from matrix components. • The signal to noise ratio must be as high as possible. • The time consumption of analysis must be short.
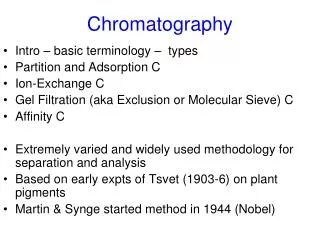
Definitions • Chromatography is a separation method. (Chromatography is not an identification method like NMR, IR, MS) Chromatography consist of two phases: mobile and stationary phase. Mobile phase is forced along the column from injection to detectoras a flowing media. Stationary phase is anchored to the column wall or to the particles, which are packed into the column.
Chromatographic process • The injected sample is dragged by mobile phase along the column. • The components of the sample distribute between the stationary phase and mobile phase. • If X compound has bigger affinity to stationary phase than affinity of Y compound to stationary phase, the X compound elutes later than Y from column. • The sharp injected peaks become broader and broader during their run.
Cross section of open tubular (capillary) General parameters Column length: 5-100 m Column diameters: 0.1-0.5 mm Film thickness: 0.15 – 5 µm Fused silica wall has no metal content. The metals can cause destruction of sample and stationary phase with their catalytic effects.
Advantages of chromatography • Exact quantitative analysis is done even from trace compounds. • Disturbing effects of matrix compound can be eliminate. • Small material consumption • The quantization has a broad linearity range. • Analyses of several compound can be done during one run. • Chromatography is a fast analysis method. • On-line coupling are routinely solved to compound identification methods, • Well establishes instrumentation with high level automation is commercially available.
Determination of trace impurity of a compounds Determination of compounds having different magnitudes in their volume.
Chromatography is highly automitized Auotomatic processes allow whole day work without human inspection. The automated processes have high reproducibility and accuracy.
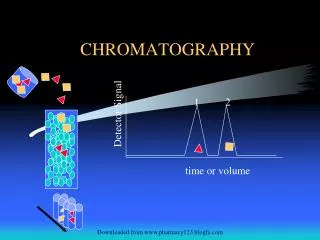
Elution profile of a chromatogram Intensity Time
Chromatographic peak An ideal chromatographic has Gaus shape Qualitative measure: retention time (tR) Quantitative measure: Peak area (A)
Chromatographic peak • A certain compound shows same retention times under same conditions (column, flow, temperature etc.) independently from its injected amount (in the linear range of Langmuir isotherm). The identity of the compounds is partly based their retention time. (Qualitative parameter) • Peak area is linear function of the quantity of certain compound (Quantitative parameter).
Chromatographic peak An ideal chromatographic has Gaus shape Qualitative measure: retention time (tr) Quantitative measure: Peak area (A)
Chromatographic peak • The given compound shows same retention times under same conditions (column, flow, temperature etc.) independently from its injected amount (in the linear range of Langmuir isotherm). The identity of the compounds is partly based their retention time. • Peak area is linear function of the quantity of certain compound.
Retention time: tR (qualitative measure) Hold up time: tm (The time, what the compounds spend in mobile phase) Peak with in half high: wh Peak area (A) (quantitative measure) Theoretical plate high: N (efficiency, sharpness ) N = 5,54 (tR/wh)2 Capacity ratio: k (Strength of stationary phase) k = tR-tm/tm Chromatographic expressions
Theoretical plate height The peaks become broader and broader during the chromatography The later eluting peak are broader than early ones. The theoretical plate height is same for all peaks. The theoretical plate height characterize the chromatographic system. The capacity ratio shows the interaction of compound of interests (distribution between the stationary and mobile phases.
Chromatographic expressions Selectivity: (Measure of interaction ratio between two compound and stationary phase) • = tR2’/ tR1’ Resolution: Rs (Measure the separation of two peaks) Rs = 1,177 (tR1-tR2)/(Wh1+Wh2) Rs : 1.5 baseline resolution
Increasing of capacity ratio with increasing of volume of stationary phase
Changing of capacity ratio with decreasing solvent strength of mobile phase Decreasing solvent strength results in longer retention times.
Distribution of the compounds between two phases • Kd = Cm/Cst = p/q • E = KdV/(1 +KdV) Where • Kd distribution constant • C m concentration of a compound in mobile phase • Cst concentration of a compound in stationaryphase • E extraction ratio • V phase ratio • Two compounds can be separated if their distribution constants are not equal (Kdx≠ Kdy).
Distribution of a compound between the mobile and stationary phases
Material distribution between the stationary phase and mobile phase K= p/q
water flow base Stones in river Light stone Heavy stone Simulation of separation
Material distribution between the stationary phase and mobile phase
Separation processes Number of the equilibrium Intensity of signal Place of materials from injection point
The slow mass transfer between the phases causes peak broadening Resistance of mass transfer processes cause that the material zone are retainedin stationary phase from the material zone in mobile phase.
Band broadening in open tube The band of sample is getting broader caused by slow diffusion from the middle of mobile phase to the stationary phase.
Band broadening caused by uneven flow The flow velocity is not uniform across the column.
Band broadening caused by badly washed holes The compounds come in and out from the holes slowly. The diffusion processes are much slower than the flow of the mobile phase.
The ideal flow of mobile phase is result of compromises U HETP =A +B/u + Cu A=Eddy Diffusion, B =Molecular Diffusion, C =Resistance to mass transfer, U =Linear velocity of mobile phase (cm/s) HETP: high equivalent theoretical plate, column HETP: N/L (L: length of)
Resolution vs. efficiency, capacity ratio, selectivity P. Sandra JHRC 12 (1989) 82.
Ways how to improve the resolution • Increase the efficiency • Longer columns • Smaller diameter of column or smaller diameter of particles • Thinner stationary phase • Optimated flow of mobile phase • Increase the capacity ratio (3-10) • Bigger amount of stationary phase • Weaker mobile phase (HPLC) • Lower analysis temperature (GC) • Increased selectivity • More selective phases • Lower analysis temperature • Derivatization
GC Chirasil-Dex 10 m Higher efficiency with smaller diameter column
Higher column length Longer column give better resolution, but longer analysis times.