Automatic Performance Management
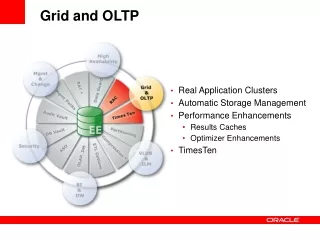
Automatic Performance Management. Tuning Statistics SGA Attach AWR Advisors Async. Commit. Objectives. After completing this lesson, you should be able to: Diagnose database performance issues Configure the Automatic Workload Repository Access the database advisors

Automatic Performance Management
E N D
Presentation Transcript
Tuning Statistics • SGA Attach AWR Advisors Async. Commit Objectives • After completing this lesson, you should be able to: • Diagnose database performance issues • Configure the Automatic Workload Repository • Access the database advisors • Use the SQL Access Advisor to improve database performance • Use asynchronous COMMIT effectively
Tuning Activities • The three activities in performance management are: • Performance planning • Instance tuning • SQL tuning
Performance Planning • Investment options • System architecture • Scalability • Application design principles • Workload testing, modeling, and implementation • Deploying new applications
Instance Tuning • Have well-defined goals. • Allocate memory to database structures. • Consider I/O requirements in each part of the database. • Tune the operating system for optimal performance of the database.
Performance Tuning Methodology • The tuning steps: • Tune from the top down. Tune: • The design before tuning the application code • The code before tuning the instance • Tune the area with the greatest potential benefit. • Identify the longest waits. • Identify the largest service times. • Stop tuning when the goal is met.
Statistics Collection • Performance tuning depends on the collection of accurate statistics. • There are different types of statistics: • Optimizer statistics • System statistics • There are different methods of collecting statistics: • Automatically, through GATHER_STATS_JOB • Manually, with the DBMS_STATS package • By setting database initialization parameters • By importing statistics from another database
Tuning > Statistics • SGA Attach AWR Advisors Async. Commit Oracle Wait Events • A collection of wait events provides informationabout the sessions or processes that had to wait or must wait for different reasons. • These events are listed in the V$EVENT_NAME view.
System Statistics V$SYSSTAT • statistic# • name • class • value • stat_id V$SYSTEM_WAIT_CLASS • wait_class_id • wait_class# • wait_class • total_waits • time_waited V$SGASTAT • pool • name • bytes V$EVENT_NAME • event_number • event_id • name • parameter1 • parameter2 • parameter3 • wait_class V$SYSTEM_EVENT • event • total_waits • total_timeouts • time_waited • average_wait • time_waited_micro
Displaying Session-Related Statistics V$STATNAME • statistic# • name • class V$SESSTAT • sid • statistic# • value V$SESSION • sid • serial# • username • command • osuser • seq# • event# • event • p1/2/3text • p1/2/3 • p1/2/3raw • wait_class • wait_time • seconds_in_wait • state • ... V$SESSION_EVENT • sid • event • total_waits • total_timeouts • time_waited • average_wait • max_wait • time_waited_micro • event_id V$EVENT_NAME • event# • name • parameter1 • parameter2 • parameter3
Displaying Service-Related Statistics • For n-tier environments, because session statistics are not as helpful, you can see service-level statistics in these views: • V$SERVICE_EVENT: Aggregated wait counts and wait times for each service, on a per event basis • V$SERVICE_WAIT_CLASS: Aggregated wait counts and wait times for each service on a wait class basis
Troubleshooting and Tuning Views Instance/Database V$DATABASE V$INSTANCE V$PARAMETER V$SPPARAMETER V$SYSTEM_PARAMETER V$PROCESS V$BGPROCESS V$PX_PROCESS_SYSSTAT V$SYSTEM_EVENT Disk V$DATAFILE V$FILESTAT V$LOG V$LOG_HISTORY V$DBFILE V$TEMPFILE V$TEMPSEG_USAGE V$SEGMENT_STATISTICS Contention V$LOCK V$UNDOSTAT V$WAITSTAT V$LATCH Memory V$BUFFER_POOL_STATISTICS V$LIBRARYCACHE V$SGAINFO V$PGASTAT
Dictionary Views • The following dictionary and special views provide useful statistics after using the DBMS_STATS package: • DBA_TABLES, DBA_TAB_COLUMNS • DBA_CLUSTERS • DBA_INDEXES • DBA_TAB_HISTOGRAMS • This statistical information is static until you reexecute the appropriate procedures in DBMS_STATS.
Diagnosis of Hung or Extremely Slow Databases • Tuning • Statistics • > SGA Attach AWR Advisors Async. Commit • Use for problem analysis when the database is performing very slowly, or is hung: • Direct access to SGA for performance monitoring (memory access mode) • V$SESSION • V$SESSION_WAIT • V$SYSTEM_EVENT • V$SYSSTAT • Hang analysis using Enterprise Manager
Using Memory Access Mode 1 4 2 3
Using the Hang Analysis Page Micro-window
Automatic WorkloadRepository • Tuning • Statistics • SGA Attach > AWR Advisors Async. Commit MMON ADDM finds top problems. SYSAUX SGA 6:00 a.m. Snapshot 1 In-memorystatistics 7:00 a.m. Snapshot 2 8:00 a.m. Snapshot 3 9:00 a.m. Snapshot 4 9:30 a.m.
AWR Snapshot Baselines Relevant periodin the past DBMS_WORKLOAD_REPOSITORY.CREATE_BASELINE ( - start_snap_id IN NUMBER , end_snap_id IN NUMBER , baseline_name IN VARCHAR2);
Tuning • Statistics • SGA Attach AWR > Advisors Async. Commit Advisory Framework:Overview PGA Advisor PGA SQL Tuning Advisor Buffer CacheAdvisor Memory SGA ADDM SQL Access Advisor Library CacheAdvisor Segment Advisor Space Undo Advisor
Typical Advisor Tuning Session Create an advisor task. Adjust task parameters. Perform analysis. Acceptresults? No Yes Implementrecommendations.
Using the SQL Tuning Advisor: Review • Use the SQL Tuning Advisor to analyze SQL statements and obtain performance recommendations. • Sources for SQL Tuning Advisor to analyze: • Top SQL: Analyzes the top SQL statements currently active • SQL Tuning Sets: Analyzes a set of SQL statements you provide • Snapshots: Analyzes a snapshot • Baselines: Analyzes a baseline
SQL Access Advisor: Overview • Workload specification • SQL statement • SQL Tuning Set • SQL cache contents • Statistics • Schema name • Recommendations • Indexes • Materialized views • Materialized view logs SQL Access Advisor
Tuning • Statistics • SGA Attach AWR Advisors > Async. Commit Asynchronous COMMIT • The default COMMIT behavior is to wait until redo is saved in the redo log files. • The default behavior can now be changed to “not wait.” • Asynchronous COMMIT is useful for high transaction throughput. • However, transactions may be lost. • Machine crashes • File I/O problems with redo log files
Using Asynchronous COMMIT • Possible combinations: • IMMEDIATE, WAIT (this is the default) • IMMEDIATE, NOWAIT • BATCH, WAIT • BATCH, NOWAIT • System- or session-level examples: • COMMIT statement examples: ALTER SYSTEM SET COMMIT_WRITE = IMMEDIATE, WAIT ALTER SESSION SET COMMIT_WRITE = IMMEDIATE, NOWAIT COMMIT WRITE BATCH WAIT COMMIT WRITE BATCH NOWAIT
Summary • In this lesson, you should have learned how to: • Diagnose database performance issues • Configure the Automatic Workload Repository • Access the database advisors • Use the SQL Access Advisor to improve database performance • Use asynchronous COMMIT effectively
Practice Overview: Using ADDM to Diagnose Performance Problems • This practice covers the following topics: • Viewing and interpreting ADDM findings to diagnose a performance problem • Implementing those findings