Download
1 / 31
310 likes | 495 Vues
Key Accomplishments Since Last Quarterly Update. Year 1 GPS-met equipment acquired by NOAA (Aug 09) Negotiations for subcontract with UNAVCO to install GPS-met equipment at Plate Boundary Observatory sites completed (Aug 09)

E N D
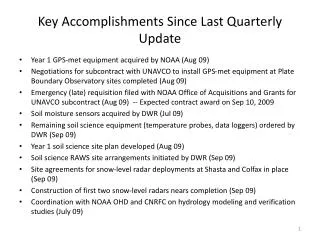
Key Accomplishments Since Last Quarterly Update • Year 1 GPS-met equipment acquired by NOAA (Aug 09) • Negotiations for subcontract with UNAVCO to install GPS-met equipment at Plate Boundary Observatory sites completed (Aug 09) • Emergency (late) requisition filed with NOAA Office of Acquisitions and Grants for UNAVCO subcontract (Aug 09) -- Expected contract award on Sep 10, 2009 • Soil moisture sensors acquired by DWR (Jul 09) • Remaining soil science equipment (temperature probes, data loggers) ordered by DWR (Sep 09) • Year 1 soil science site plan developed (Aug 09) • Soil science RAWS site arrangements initiated by DWR (Sep 09) • Site agreements for snow-level radar deployments at Shasta and Colfax in place (Sep 09) • Construction of first two snow-level radars nears completion (Sep 09) • Coordination with NOAA OHD and CNRFC on hydrology modeling and verification studies (July 09)
Outline • Major Activity Areas: • Status of Observation Projects • GPS-met • Soil moisture • Snow-level radar • Status of Modeling and Display Projects • Status of Decision Support Projects • Tier-II • Summary/Actions
Observing Implementation Accomplishments • GPS-met • It was agreed upon by PMT that a mix of sensor deployments on the GPS-met project was possible – Jun 09 • Vaisala met packages acquired by NOAA – Aug 09 • Subcontract with UNAVCO negotiated to install GSP-met equipment at PBO sites – Aug 09 • UNAVCO subcontract awarded – Sep 09 • Deployment – Sep-Oct 09
Locations of the eight sites at which UNAVCO will install met packages (pink dots). UNAVCO will also start real-time streaming from six of these sites (two already have real-time streaming). Also shown are five sites in the PBO network where UNAVCO has already installed met packages (blue diamonds). NOAA will contract with UNAVCO to start real-time streaming from these sites as well.
Same as previous figure except now showing the nine additional existing GPS-Met sites (brown squares). These existing sites are interrogated every 30 or 60 minutes. The full network has good coverage along the I-80 corridor, as well as central coast and inland valley “picket fences.”
Observing Implementation Accomplishments • GPS-met • It was agreed upon by PMT that a mix of sensor deployments on the GPS-met project was possible – Jun 09 • Vaisala met packages acquired by NOAA – Aug 09 • Subcontract with UNAVCO negotiated to install GSP-met equipment at PBO sites – Aug 09 • UNAVCO subcontract awarded – Sep 09 • Deployment – Sep-Oct 09 • Soil moisture • Soil moisture sensors acquired by DWR – Jul 09 • Remaining soil science equipment ordered by DWR – Sep 09 • Year 1 soil science site plan developed – Aug 09 • Site arrangements with RAWS operators initiated by DWR – Sep 09 • Deployment– Sep-Oct 09
Yr1 Soil Science Site Plan • 7 sites in Sierra; 3 sites in Russian/Napa basins • Sierra network brackets HMT and Yosemite networks with picket fence at roughly 4600-6700 ft altitude range where precipitation type varies most from storm to storm • Yosemite Hodgdon Meadows site collocated with Scripp’s site for instrument intercomparison • Russian/Napa network complements three HMT sites on lower Russian • Final site selection dependent on suitability and accessibility of suggested sites (Gherke, Zamora)
Observing Implementation Accomplishments • GPS-met • It was agreed upon by PMT that a mix of sensor deployments on the GPS-met project was possible – Jun 09 • Vaisala met packages acquired by NOAA – Aug 09 • Subcontract with UNAVCO negotiated to install GSP-met equipment at PBO sites – Aug 09 • UNAVCO subcontract awarded – Sep 09 • Deployment – Sep-Oct 09 • Soil moisture • Soil moisture sensors acquired by DWR – Jul 09 • Remaining soil science equipment ordered by DWR – Aug 09 • Year 1 soil science site plan developed – Aug 09 • Site arrangements with RAWS operators initiated by DWR – Aug 09 • Deployment – Sep-Oct 09 • Snow-level radar • Snow-level radar bistatic antenna design finalized – Jun 09 • First radar built and tested in Boulder – Aug 09 • Test dataset proves radar will perform as well or better than expected – Aug 09 • Finish building and deploy first two units (American RB, Shasta Res) – Sep-Oct 09
The snow level radar design. A 12-ft trailer will be used for the deployments instead of the 10-ft trailer shown here. The radar antennas sit down inside the two corrugated aluminum shrouds. The 45-degree angled shroud tops will be wrapped with marine and industrial shrink wrap to help shed precipitation. The radar electronics and data communications equipment are rack mounted in the environmentally controlled locker located in between the two antenna shrouds.
Insects Bright Band Radar reflectivity data (uncalibrated) from the FM-CW snow level radar prototype collected on August 30, 2009. The straight horizontal lines are from signals internal to the radar that are present in the prototype. The new radars will have much better power supplies that will not show these lines.
In addition to the two FMCW snow-level radar deployments at Shasta Dam and Colfax supported by DWR, there will be a number of other types of HMT profiling radars that will be providing snow-level measurements across the State for the upcoming winter season. Also shown are two additional sites in the Carquinez Strait (Concord Airport) and at Mariposa, planned to be supported by the California Energy Commission for the CalWater field experiment.
Assimilation, Modeling and Display Accomplishments • Real-time ensemble modeling • Expanded forecast length to 120 hrs to meet needs of RFC/WFO - Oct 08 • Grid resolution reduced to accommodate model cycle and larger domain (3 to 9 km) - Oct 08 • Special rapid refresh (1 hr forecast) model out to 12 hours for flux tool - Nov 08 • Runs are completed in less than 3 hrs - Nov 08 • Ensemble has been running since Nov 1, Obs/model flux tool running (Feb 09) • Basic probabilistic post processing • Probabilistic post processing completed- starting with weights from last year- 1 Dec • Sets of products produced (ensemble means, 6-h precip thresholds) - Dec 08 • Displayed on ALPS at Monterey, Sacramento (RFC & WFO), and Eureka - Jan 09 • Hydrological (river flow) experiments • Year 1, planning and coordination (RFCs and OHD), preliminary experiments with NSSL (meetings with OHD and CNRFC) • Verification sub-system • Precipitation (point observations) - Using WRF Met (NCAR) under development for real time - Dec 08 • Basin Precip - Jan-Feb 09 • State variables (point observations and grids) - Jan - Feb 09 • Freezing level, rain-snow elevation - cross-sections available, no verification as yet – Apr-Jun 09
ALPS - Advanced LINUX Workstations • Remote access to special HMT datasets in field offices along with regular product streams • Water vapor flux tool (for 2009/10) • Research NWP • MADIS datasets • Workstations successfully deployed at five offices (Sacramento WFO and RFC; Eureka, Monterey, and Reno WFOs) during the last two field seasons • “Smart pull” redesigned after 1st year – performance significantly improved
Calibration of PQPF Probabilistic QuantitativePrecipitationForecasts Four rerun HMT-West-2006 cases: IOP1, 4, 10, 12 Cross-validation over the ARB Reliability curves are improved (red line along the diagonal) for the thresholds 1-25 mm/6-h Internal histograms: Frequencies changed Yuan et al. 2008, JHM
Runoff experiments Validation events: IOP5, HMT2007 The distributed hydrologic model: Two-Dimensional Runoff Erosion and Export (TREX) model 100 m2pixel Ensemble created from 12 combinations of hydro model parameter perturbations (calibrated from IOP1HMT2006) using inputs from: 1) 0-6 h ensemble mean QPF, 3-km 2) Stage IV QPE, ~ 4 km 3) CNRFC QPF day 1- day 3 forecasts, ~ 4 km By Yuan, H.,J. J. Gourley, P. J. Schultz, J. A. McGinley, Z. Flamig, C.J. Anderson
Average skill scores for streamflow simulations from 14 IOPs Ranked Probability Score (RPS) is computed for using the 0-6 h ensemble mean QPF, 6-h Stage IV, CNRFC day1 to day 3 forecasts with 14 IOPs during three winters (HMT-2006, 2007, 2008) Smaller RPS is better. The high-reso ensemble QPF is the best in terms of peak and volume, and is worse than Stage IV input in the peak timing.
AHPS How an Ensemble-Based System Works Observations 18 Basin Rainfall Forecasts 18-Model Ensemble 18 weather opinions 54 Stream/River Flow Scenarios Hydro Runoff Models Ensemble Mean Threshold Probabilities Hydro Runoff Models 3 Hydro Runoff Models Flow rate Probability Post processing
Building Blocks Toward Developing Decision Support Tools Reliable precipitation and stream flow forecasts Reservoir Operations Evaluations & Predictions New extreme QPF & snow level performance measures New atmospheric river index (PARTI) New Flash Flood Monitoring and Prediction (FFMP) products New probabilistic NWP products Evaluate Evaluate Predict Predict
New Demonstration Performance Measures • Baseline performance measure for extreme QPF has been established – results presented at 2009 AMS mtg and formal publication upcoming • Baseline performance measure for snow level has been established – results presented at 2008 Fall AGU mtg and formal publication upcoming • Because ARs contribute significantly to precipitation, snowpack modulation, anomalously high snow levels, and flooding in western North America, they represent a key phenomenon linking weather and climate.
Landmark paper by ESRL scientists in U.K. Journal of Water Management (April, 2009) uses HMT observations to understand the atmospheric river conditions that lead to heavy precipitation and uses these observations to develop a tool for forecasters to detect and monitor land-falling atmospheric rivers and their impacts on heavy mountain precipitation.
Coastal Atmospheric River Monitoring and Early Warning System HMT Weather Forecast Model Coastal Wind Profiler New and improved tool (2009) combines HMT observations and numerical model forecasts to detect, monitor, and predict the impacts of atmospheric rivers on extreme precipitation. It also allows forecasters to judge how well models are representing the atmospheric river forcing and the resulting precipitation. GPS Water Vapor Prior Forecasts Water Vapor Flux: the fuel for precipitation Coastal and Mtn. Rainfall
AR Index 10 contiguous pixels (~5000 km2) of the most moist SSM/I IWV in each AR w/in 1000 km of coast. Maximum SSM/I IWV (cm) in California Land-Falling ARs WY1998-2008 (Daily am&pm occurrences Oct-Apr) From the above inventory, the strongest vertically integrated vapor flux (IVT) in each AR w/in 1000 km of coast. Dates from the 20 top 3-day precip. events between 1949-2007 (from the CDC 0.25x0.25 deg unified precip. dataset) in the Sierra from Wes Junker are also marked. (04) 12/14/02 (06) 02/14/86 (09) 01/09/05 (10) 11/18/50 (18) 12/12/95 (19) 02/13/00 (11) 01/05/66 (12) 01/18/69 (14) 11/11/73 (13) 12/18/81 (15) 02/06/60 (16) 01/22/70 (08) 03/09/95 (20) 03/29/74 (03) 12/21/55 (07) 01/15/74 (02) 01/31/63 (05)12/30/05 (17) 01/01/97 (01) 12/22/64 Max. Global Reanalysis IVT (kg m-1 s-1) in California Land-Falling ARs WY1998-2008 (Daily occurrences Oct-Apr)
Five potential tasks have been identified for NOAA’s Flash Flood Monitoring and Prediction (FFMP) tool in HMT. Following are recommendations that were made during a meeting at NOAA/ESRL on • 23 April 2009 • 1) Use of Integrated Water Vapor Flux as Nonintegrated Guidance • Goal • Provide a simple form of guidance that would inform the forecaster how likely Atmospheric River conditions are, and to what degree they may enhance precipitation. • Conclusion:Proceed • There is no need to provide a simple jpg image in AWIPS (the existing flux tool web interface will suffice), thus the Guardian approach for the graph will not be pursued. • A fully integrated approach would be better, thus W. Roberts will try to define the level of effort and potential due date regarding getting the Volume Browser in AWIPS to produce a time-height trend like those in the existing web interface. • Guardian still can be used to provide a high-level, situational awareness element, but it would require a locally written script or application to calculate a threshold (or derive an index) and then create entries in the Guardian configuration to provide a water vapor flux monitor. The data is available now at the NWS Office in Monterey, so ESRL will send logic rules to the office for the decision-making portion, and T. Filiaggi (FFMP developer) will assist the Office with Guardian when the logic is ready for display/monitor.
2) Debris Flow: Short Term QPF • Goal • Provide 30-minute quantitative precipitation forecasts (QPF) and ingest them into FFMP. The 30-minute QPF might be applicable to Debris Flows. This could be done via one or both of the following: the High-Resolution Precipitation Forecaster (HPN) tool , NOAA/NSSL’s Q2. • Conclusion:Proceed • Focus on HPN over Q2 at this time, however, this must be worked through NOAA/OHD in order to get NOAA/OHD officially on board. • HPN data files in AWIPS already have place-holders for short-term QPF and the processors are calculating short-term QPF, but just not writing the data out to file currently. All that is required basically is to get HPN to write out the short-term QPF (15, 30, 45 minute) and add FFMP Data Source configuration entries, with use of a Relate Key. • There is a concern about advection schemes not handling the stationary characteristic of orographic precipitation very well.
3) Additional QPF from NWP • Goal • Get WRF model QPF into the FFMP at the NWS Office in Monterey, in a valuable way. (Note that WRF QPF is a pre-existing HMT task.) • Conclusion: On hold • We decided we need to wait for more mature model evaluation. • WRF resolutions as coarse as 12-14 km may result in ‘poor’ precipitation forecasts, thus resolutions of 1km (nested) could be very poor. • If at some point we do proceed with this issue, perhaps we can call it “Guidance” in FFMP (instead of “QPF”) and allow the update rate to continue to be hourly, and perhaps also slacken the spatial resolution requirement. • 4) Use of Integrated Water Vapor Flux (IWVF) for QPF / Enhanced QPF • Goal • Somehow use IWVF values to either generate localized QPF or locally enhance QPF from another source. Candidate sources are: • WRF: Same nesting issues as above. • HPE: Exists operationally in AWIPS as of Operational Build 9 (March 2009). • Q2 • Conclusion:On hold • It was decided that this issue should be absorbed by the issue above and placed on hold for the same reasons. • Perhaps consider the above issue “WRF QPF” and this issue “Bias corrected WRF QPF”, similar to the way we have High-Resolution Precipitation Estimator (HPE) and BiasHPE (radar bias corrected) in FFMP.
5) Debris Flow: Short Term QPF • Goal • USGS ingests real-time QPE from WFOs • USGS provides Debris Flow thresholds based on the real-time data, thus the Debris Flow assistance would be more dynamic • USGS sends their updated thresholds to WFOs for use in AWIPS and FFMP • (Scientifically speaking, how valuable is it for the Debris Flow assistance to be as dynamic as described above? It is assumed true real-time updates are not necessary, but defining a clear path for interaction, when an update is deemed necessary, would be great!) • Conclusion:Not available at this time.