Download
1 / 58
580 likes | 705 Vues
BicAT_Plus: An Automatic Bi/Clustering Comparative Tool of Gene Expression Data Obtained Using Microarrays. Fadhl M. Al-Akwaa Biomedical Eng. Dept., Univ. of Science & Technology, Sana’a, Yemen Biomedical Engineering Department, Cairo University, Giza , Egypt Mohamed H. Ali

E N D
BicAT_Plus: An Automatic Bi/Clustering Comparative Tool of Gene Expression Data Obtained Using Microarrays Fadhl M. Al-Akwaa Biomedical Eng. Dept., Univ. of Science & Technology, Sana’a, Yemen Biomedical Engineering Department, Cairo University, Giza , Egypt Mohamed H. Ali Computer Science School, Nottingham University, Nottingham, United Kingdom Yasser M. Kadah Center for Informatics Sciences, Nile University, Egypt Biomedical Engineering Department, Cairo University, Giza , Egypt
What is Bioinformatics? Bioinformatics is defined as the creation and advancement of databases, algorithms, computational and statistical techniques, and theory to understanding of biological processes.
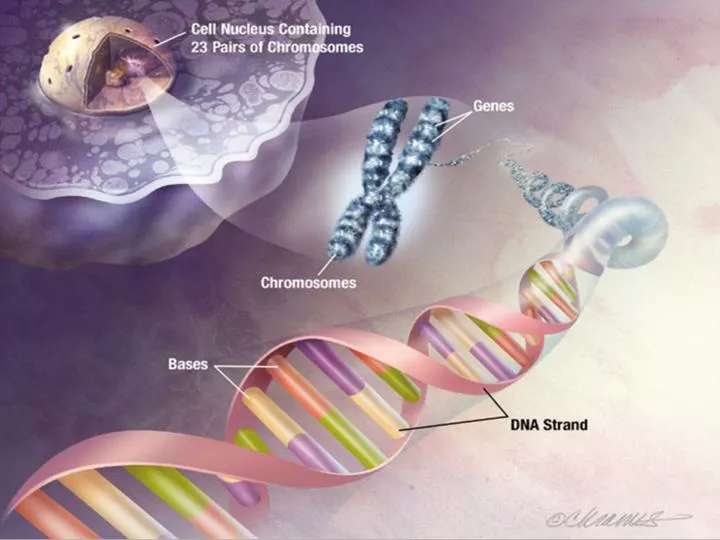
The Central Dogma DNA nucleus Transcription RNA cytoplasm Gene Expression Level Translation cytoplasm D F T PROTEIN A A S K G N S G
+ + GENE A + - Biological Balance Feedback System Translation Rate Disease Drug Gene on Gene off Gene Expression Level Protein Level Transcription Rate External or internal stimuli
Transcriptome data: Microarray Technology Gene Expression Data
+ + GENE A GENE B - Biological Balance Feedback System Translation Rate Translation Rate + Protein Level Gene Expression Level Gene Expression Level Protein Level + + Transcription Rate Transcription Rate - External or internal stimuli +
_ g1 _ + - _ g2 g3 + + _ g4 _ Biological Balance Feedback System Gene A Gene B Gene Regulatory Network GRN Balance Feedback Loop system
Biological Data Base DNA Transcription RNA Translation PROTEIN D F T A A S K G N S G
Drug Discovery • One of the main objective of bioinformatics is how to integrate this database to advance in human health. Drug Discovery Disease Ontology
_ g1 _ + _ g2 g3 + + _ g4 _ Drug Discovery & GRN • The costs to bring a new drug vary from around 500 million to 2,000 million dollars • Drug Design required the sophisticated understanding of how genes interact with each others construct GRN.
Drug Discovery: GRN steps Experimental Design Data Extraction Preprosseing Microarray Image Segmentation Prepare Microarray chip Sampling rate Error Experimental condition Gene Expression Matrix Normalization Discretization Filtration Missing value Low entropy Low variance Dynamics Bayesian Network Probabilistic boolean Network Fuzzy network ……… Traditional clustering methods Bicluster methods Drug Testing Network Generation Gene Clustering
Gene Expression Data Analysis: Clustering similarity matrix cluster genes based on similarity n genes n genes n genes m assays • Euclidean Distance • Correlation coefficient • Pearson
Hierarchical Clustering g1 g4 • Find largest value in similarity matrix. • Join genes together. • Recompute matrix and iterate.
Hierarchical Clustering g2 g3 g1 g4 • Find largest value is similarity matrix. • Join clusters together. • Recompute matrix and iterate.
Hierarchical Clustering g5 g2 g3 g1 g4 • Find largest value is similarity matrix. • Join clusters together. • Recompute similarity matrix and iterate.
Hierarchical Clustering : dendogram Eisen et al. (1998), PNAS, 95(25): 14863-14868
Gene Expression Data Analysis: Clustering • Cluster is a group of genes show similar expression profile along the experiments • Examples • K-means • Hierarchal • Self Organization Map • Click • Model based clustering Eisen et al. (1998), PNAS, 95(25): 14863-14868
Gene Expression Data Analysis: biClustering George M. Church Professor of Genetics, Harvard Medical School the mean squared residue score (MSRS),
Which algorithm is suitable for my dataset? Paper IDEA Which algorithm is better? And do some algorithms have advantages over others? Generally, comparing different biclustering algorithms is not straightforward as they differ in strategy, approach, computational complexity, number of parameters, and prediction ability. Moreover, such methods are strongly influenced by user selected parameter values.
BicAT-plus • To our best knowledge, bicluster compassion toolbox has not been available in the literature. • We have developed a comparative tool, which we will call “Bicat-plus” that includes the biological comparative methodology to enable researchers and biologists to compare between the different bi/clustering methods based on set of biological value and draw conclusion on the biological meaning of the results.
BicAT • BicAT-plus is extension of BicAT Toolbox which is popular gene expression analysis toolbox which contains 5 biclustering and 2 traditional cluster algorithm. • OPSM • CC • ISA • X-motive • BIMAX • K-means • Hierarchal
BicAT-plus Comparison Methodology Algorithm A (n biclusters) Algorithm A (m biclusters) g1,g4,g5, g1,g4,g5, g1,g2,g3,g4,g5,… Enriched g1,g2,g3,g4,g5,… g1,g2,g3,g4,g5,… g1,g2,g3,g4,g5,… g1,g2,g3,g4,g5,… g1,g2,g3,g4,g5,… g1,g2,g3,g4,g5,… g1,g2,g3,g4,g5,… Enriched bicluster= have biological meaning not Enriched g1,g2,g3,g4,g5,… g1,g2,g3,g4,g5,… Function Pathway PPI Promotor GO KEGG BIOGRID GENE BANCK
BicAT-plus Comparison Methodology • Percentage of enriched bi/clusters • Percentage of annotated genes per each bi/cluster • The predictability power of algorithm to recover interested pattern selected by user.
BicAT-plus Features • Adding more algorithms to the BicAT-plus tool in order to have one software package that employs most of the commonly used biclustering algorithms.
BicAT-plus Features • Perform functional analysis (Gene Ontology) of bicluster genes using different GO categories • Biological Process • Molecular Function • Cellular Component
BicAT-plus Features • Displaying the analysis and comparing results using graphical and statistical charts visualizations in multiple modes (2D and 3D).
BicAT-plus Features • Comparing between the different biclustering algorithms based on different respective methdology
BicAT Comparison Steps Manual file http://home.k-space.org/FADL/Downloads/BicAT_plus.zip
Results We used Gasch gene expression data. http://genome-www.stanford.edu/yeast_stress/ We used the default parameters as authors recommend in their publications.
The predictability power of algorithm to recover interested pattern The conditions applied in Gasch experiments varied from temperatureshocks, hydrogen peroxide, the superoxide-generating drug menadione,the sulfhydryl-oxidizing agent diamide, the disulfide-reducingagent dithiothreitol, …… The user could compare bi-clusters algorithms based on which of them could recover defined pattern like which one of them could recover biclusters which have response to the conditions applied in Gasch experiments.
Conclusionhttp://home.k-space.org/FADL/Downloads/BicAT_plus.zipConclusionhttp://home.k-space.org/FADL/Downloads/BicAT_plus.zip BicAT-plus is a flexible, open-source software tool written in java swing and it has a well structured design that can be extended easily to employ more comparative methodologies that help biologists to extract the best results of each algorithm and interpret these results to useful biological meaning.
BicAT-plus This figure for people that want to extend BicAT-plus by adding new features (or fixing bugs).
Conclusion The comparison methodology used in this study confirm that the bicluster and cluster algorithms can be considered as integrated modules; there is no certain algorithm that can recover all the interesting patterns, what algorithm A success to recover in certain data sets, Algorithm B might fail, and vice verse.
Conclusion • Using BicAT-plus, we can identify the highly enriched bi/clusters of the whole compared algorithms, Integrating them to solve the dimensionality reduction problem of the Gene regulatory network construction from the gene expression data where samples number are fewer than number of genes in the microarray dataset.
BicAT-Plus http://home.k-space.org/FADL/Downloads/BicAT_plus.zip
Availability and Requirements • Availability: you can free download from • System requirements • Java Runtime Environment (JRE). version 6 is recommended. • Active Perl version 5.10 Note BicAT plus has been tested on a PC machine with the following configurations: CPU: Pentium 4, 1.5 GHZ, RAM: 2.0 GB, Platform: windows XP professional with SP2.
Algorithms comparison • Generally, comparing different biclustering algorithms is not straightforward as they differ in strategy, approach, computational complexity, number of parameters, in addition to prediction ability. • Moreover, such methods are strongly influenced by user selected parameter values. As a result, the quality of biclustering results is often considered more important than the required computation time.
Algorithms comparison • Although there are some analytical comparative studies to evaluate the traditional clustering algorithms (Azuaje, 2002; Datta and Datta, 2003; Yeung, et al.), no such comprehensive comparison of biclustering methods can be found in the literature so far (Prelic, et al., 2006).
Cluster/bi-cluster algorithm performance comparison: Cluster Evaluation Cluster 2 Cluster 1 Cluster n g1,g2,g3,g4,g5,… g1,g2,g3,g4,g5,… g1,g2,g3,g4,g5,… …….. • Homogeneity between cluster genes • Separation between clusters “it is not clear how to extend notions such as homogeneity and separation (Gat-Viks et al., 2003) to the biclustering context (to our best knowledge, no general internal indices have been suggested so far for biclustering) “Prelic, et al., 2006
Cluster/bi-cluster algorithm performance comparison: Bicluster Evaluation bicluster 2 bicluster 1 bicluster n g1,g2,g3,g4,g5,… g1,g2,g3,g4,g5,… g1,g2,g3,g4,g5,… …….. Function: hypergometric test with GeneOntology database Pathway: KEEG PPI: Biograd database Promotor: Scan motif program
Hyper Geometric Test Cluster1 Reference set (N genes) Test set (X genes) when sampling X genes (test set) out of N genes (reference set), what is the probability that x or more of these genes belong to a functional category C shared by n of the N genes in the reference set?”. g1, g2, g3, g4, g5, g6,g7,g8,g9,gN g1, g2, g3, g4, g5, g6,g7,g8,g9,gX Steven et al.(Maere, et al., 2005)
The Gene Ontology g1, g2, g3, g4, g5, g6 • The Gene ONTOLOGY (GO) is aproject to put annotated genes( known function genes) in groups. • Example in S. cerevisiae • Function name =cellular response to glucose starvation function ID=GO:0042149