Download
1 / 31
310 likes | 455 Vues
Enterococci in the Hudson River. What is it? What does it tell us? How does it get in the river? How do we test for it? What can we do about it? PPT adapted from the summer 2007 research of

E N D
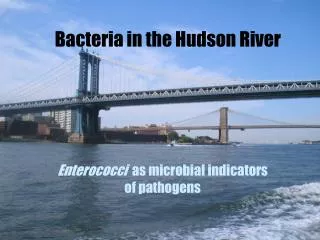
Enterococci in the Hudson River • What is it? • What does it tell us? • How does it get in the river? • How do we test for it? • What can we do about it? PPT adapted from the summer 2007 research of Suzanne Young, Barnard graduate. Project funded by The Hudson River Foundation through a Polgar Fellowship. (adapted by M. Turrin for Snapshot Day website)
What is Enterococci bacteria? • A bacteria correlated with many of the human pathogens found in raw sewage. • It replaced ‘fecal coliform’ as the federal standard for water quality in public beaches in brackish/estuarine waters. • Enterococci strongly correlates with swimmer illness so it is useful for testing in areas where the water carries a ‘recreational use’ classification* *It is a goal of the Hudson River Estuary Program Action Plan that much of the river will fall under this classification.
What are Potential Sources of Sewage in the Hudson? • Combined sewer outfalls* • Malfunctioning wastewater treatment facilities • Malfunctioning septic tanks • Runoff from streets and banks of waterways • Waste from boats and swimmers * where sewage and storm drains are connected - as in NYC and - rainfall can cause the system to overload, bypassing the treatment facility
NYCDEP How do CSOs work?
CSO Facts for New York City • 70% of NYC’s sewers are combined • More than 494 outfalls in NYC • Overflow can occur with 1/10th inch of rainfall due to all the pavement and other impervious surfaces! • Individual outfalls release sewage 50-80 times per year • 27 billion gallons/year is released in NYC Take a look at a ruler and see what a little amount of rain 1/10th inch is! That equates to once every 4.5 to 7 days, or the equivalent of one to two times a week!
In this study Enterococci is studied as indicators of raw sewage in the Hudson River focusing on two locations Piermont Pier in Rockland County 125th street in West Harlem
Piermont Pier Suzanne collecting a water sample
Tested using EPA Method 1600, which does not distinguish sources of the bacteria, only presence & rate of presence The EPA standard for a single sample maximum is 104 Colony Forming Units (104) per 100ml of sample water. Presence - shows entero colonies to be counted Absence - Clean agar plate with no growth
EPA Method 1600: Membrane Filtration • The Procedure • Collect samples • Dilute samples • Filter diluted samples • Incubate on mEI agar plates • Count colony growth
Filtration Incubation at 41°C Colony Count (As viewed through a microscope)
Combined sewage outfall >1500 CFUs/100ml
3ml dilution >1500 CFUs/100ml
Second Site - Piermont Pier - sampled in 2 places in Sparkill Creek and 3 spots around the pier Piermont Sampling Sites North Side of Pier End of Pier South Side of Pier Sparkill Creek: Below Dam Sparkill Creek: Above Dam
Piermont: North and South of Pier Here is the data from sampling both sides of the pier. It seems the south side has a regular contribution. P-value= .007 P-value <.05 *See next slide for discussion of geometric mean
Geometric mean & water quality • Many wastewater dischargers, or regulators who monitor swimming beaches and shellfish areas, must test for and report bacteria concentrations. Often, the data must be summarized as a "geometric mean" (a type of average) of all the test results obtained during a reporting period. • WHY? A geometric mean, unlike an arithmetic mean, tends to reduce the effect of very high or low values, which might bias the mean if a straight average (arithmetic mean) were calculated. This is helpful when analyzing bacteria concentrations, because levels may vary anywhere from 10 to 10,000 fold over a given period. In our sample on the previous page the range was from 10 to 1500, still a large span. • Very generally the geometric mean is really a log-transformation of data to enable meaningful statistical evaluations. Practical definition: The average of the logarithmic values of a data set, converted back to a base 10 number.
North Side South Side On the South side of the pier is the Sparkill Creek and an outfall pipe. Look at the next slides to see if you can tell how much each might have contributed to the ENT counts. Outfall Pipe
Sparkill Creek P-value= .18 Both the upper & lower Sparkill sites seem to be regular contributors
Outfall and Mid-Channel Comparison P-value= .055 Sampling at the outfall varies considerably with just over half the samples exceeding standards. Piermont Outfall (from boat) Tappan Zee Mid-channel
Tappan Zee Bridge Mid-Channel sampling site from boat Piermont Pier Outfall sampling site from boat Could you argue that the Sparkill Creek also contributes to the Outfall sampling site? Would the tidal cycle at sampling time have any impact on contributions found from the Sparkill or the Outfall?
Previous Studies have considered other items like: • Salinity - found salinity negatively correlates with ENT • Grazing Communities - will affect bacteria mortality & inactivity • UV light - affects bacteria mortality& inactivity • Sediment - Like many other contaminants, bacteria can be retained & resuspended in sediments. Tidal resuspension of sediments is a factor to consider.
Conclusions • Rainfall strongly correlates with ENT concentrations • Tidal action may influence persistence of ENT or disturb sediment and resuspend • Some wastewater treatment plants are not up-to-date with effective treatment processes • There is a need for holistic approaches, ecologically sound practices such as those suggested in the following slides…
Current CSO Legislation - legislation attempts to control the problem through laws/legal remedies • Clean Water Act - enacted 1977 • EPA CSO Control Policy • Long Term Control Plans (submitted 6/30/07) • Tank construction • Floatables controls • Wet weather capacity upgrades • Sewer system improvements • No discussion of BMPs (best management practices) to reduce stormwater volume
We need to switch from thinking of stormwater as a WASTE to be treated (costing the city more money and energy) to looking at it as a RESOURCE to be used. • Yes, capturing more stormwater so that less volume actually reaches the rivers or sewersand treatment plants
One small way - encouraging Green Roofs/Rooftop Gardens • Capture and absorb stormwater • Create wildlife habitat • Counteract “urban heat island” effect • Aesthetic benefits • Costs ~$8-10/sq.ft. more than reg.
Incentives • first municipal green roof in country atop city hall • Provides grants and stormwater “credits” • Density bonus in central business district • Expedited permit process, fee waivers Chicago leads U.S. in sq.ft. of green roofs
PLANYC In 2007, property tax abatement to offset 35% of the installation cost of green roofs
What Other Ideas Can you Think Of? • 1.More street trees • 2.Rain barrels • 3. • 4. • 5.
Suzanne’s research was supported with help from:Peter BowerGreg O’MullanSarah McGrathJohn Lipscomb and RiverkeeperLamont Doherty Earth Observatory Hudson River FoundationNatural Resources Defense Council