Download
1 / 1
10 likes | 132 Vues
Ocean Data Inventory (ODI). Ocean Sciences at BIO provide public access to six databases of physical, biological and chemical oceanographic data. A one-time registration provides access to all of the applications

E N D
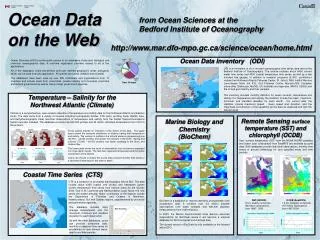
Ocean Data Inventory (ODI) Ocean Sciences at BIO provide public access to six databases of physical, biological and chemical oceanographic data. A one-time registration provides access to all of the applications All of the databases share pre-defined and user defined geographic areas (polygons) which can be used from any application. All queries are saved, editable and reusable. The databases have been used by over 550 individuals and organizations from 17 countries and include users from universities, private industry and municipal, provincial and federal government as well as many foreign government agencies. ODI is an inventory of all of moored oceanographic time series data held at the Bedford Institute of Oceanography. The archive includes about 5400 current meter time series and 4300 coastal temperature time series, as well as a few hundred tide gauges. In addition to research programs at BIO, contributors include the Northwest Atlantic Fisheries Center, St. John's, Nfld, Institut Maurice Lamontagne, Mont Joli, P.Q., Gulf Fisheries Centre, Moncton,N.B, Canadian universities (Dalhousie, McGill), US institutes and agencies (WHOI, USGS) and the oil and gas industry and their partners. The inventory includes monthly statistics for ocean currents, temperature and salinity. For temperature and salinity, the statistics include the mean, maximum, minimum, and standard deviation for each month. For current data, the statistics include maximum speed , mean speed and direction, and the magnitude and direction of the variability for the data as observed and with the tide removed. User Groups Remote Sensing surface temperature (SST) and chlorophyll (OCDB) Marine Biology and Chemistry (BioChem) Sea –surface temperature (SST) from the NOAA AVHRR satellites and ocean color (chlorophyll) from SeaWiFS are available as point data. Both databases provide individual observations, monthly time series or annual climatology for user specified areas and time periods. 1921-1975 1961-1989 1976-1989 1990-2003 Coastal Time Series (CTS) CPR 1961-2001 1990-2003 CTS is a collection of all coastal thermographs held at BIO. The data include about 4300 coastal (red circles) and freshwater (green circles) temperature time series from inshore areas for the Scotian Shelf, Gulf of St. Lawrence and Newfoundland coast. About 100 new series are added annually. Major contributors to the dataset include the Department of Fisheries and Oceans in Maritimes, Newfoundland, Gulf and Quebec regions, supplemented by provincial and partnership agencies. Nafo Area 4Xq SST(AVHRR) 9 km. weekly composite 58 million observations from 1985 - 2003 OCDB (SeaWIFS) 1.5 km. biweekly composite 157 million observations from 1997-2004 BioChem is a database of marine chemistry, phytoplankton and zooplankton data. It contains over 2.2 million discrete observations from water samples and 620,000 plankton measurements from 1650 missions. In 2003, the Marine Environmental Data Service assumed responsibility for BioChem where it will become a national database for DFO biological and chemical data. The current version of BioChem is only available on the Intranet within DFO. The database includes daily average temperatures and the maximum, minimum and standard deviation for each observation. As with the other databases, users can produce composite daily, monthly or seasonal time series for pre-defined or user defined areas, depths and time periods. Ocean Data on the Web from Ocean Sciences at the Bedford Institute of Oceanography http://www.mar.dfo-mpo.gc.ca/science/ocean/home.html Temperature – Salinity for the Northwest Atlantic (Climate) Climate is a comprehensive, open access collection of temperature and salinity data for the Northwest Atlantic and Eastern Arctic. The data come from a variety of sources including hydrographic bottles, CTD casts, profiling floats, Batfish tows, and bathythermographs. Near real-time observations of temperature and salinity from the Global Telecommunications System are also included. The database currently has 630,000 profiles and 30 million individual observations from 1910 to the present. These panels provide an indication of the extent of the data. The upper figure shows the seasonal distribution of stations having both temperature and salinity. The number of profiles in the fall and winter is comparatively low (30,000 – 40,000 profiles) and almost non-existent in the north. Spring and summer (70,000 – 80,000 profiles) has better coverage in the Arctic and Hudson Bay. The lower panel shows the count of observations from all stations separated into three depth ranges. The dark bars represent temperature and the lighter colored bars show salinity. Users can choose to extract the source data, produce monthly time series or a seasonal climatology for any area or depth.