Download
1 / 46
460 likes | 567 Vues
This study explores the climatology of Appalachian Lee Troughs (ALTs) and their significant role in the occurrence and intensity of severe thunderstorms in the Mid-Atlantic region of the United States. We analyze 13 case studies related to ALTs, highlighting how these troughs, characterized by weak forcing and high instability, contribute to storm formation. Our findings show that ALTs are prevalent during warm months, especially in June through August, and are critical for improving forecast accuracy for thunderstorms affecting the Eastern Seaboard.

E N D
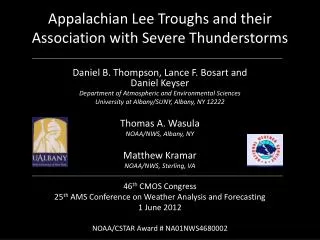
Appalachian Lee Troughsand their Association with Severe Thunderstorms Daniel B. Thompson, Lance F. Bosart and Daniel Keyser Department of Atmospheric and Environmental Sciences University at Albany/SUNY, Albany, NY 12222 Thomas A. Wasula NOAA/NWS, Albany, NY Matthew Kramar NOAA/NWS, Sterling, VA 46th CMOS Congress 25th AMS Conference on Weather Analysis and Forecasting 1 June 2012 NOAA/CSTAR Award # NA01NWS4680002
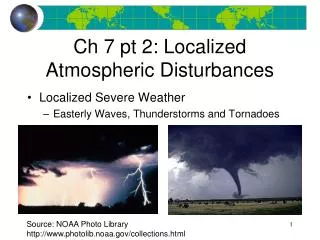
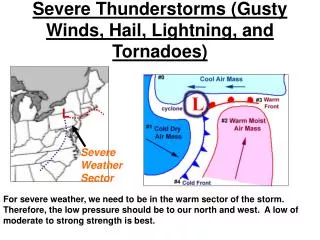
Motivation • Region of study: Mid-Atlantic U.S. • Accurate forecasts of location, mode and severity of thunderstorms are important, due to proximity of Eastern Seaboard • Region is often characterized by weak forcing and ample instability during warm season • Mesoscale boundaries important • Sea breeze boundary • Outflow boundaries • Lee trough
Outline • Climatology of Appalachian lee troughs (ALTs) • Categorization scheme for ALTs • Spatial frequency of storm reports by ALT category • Summary of key points
Outline • Climatology of Appalachian lee troughs (ALTs) • Categorization scheme for ALTs • Spatial frequency of storm reports by ALT category • Summary of key points
Data and Methodology – Climatology • Analyzed 13 cases of ALT events associated with warm-season severe convection • Sterling, VA (LWX), CWA • 0.5° CFSR (Climate Forecast System Reanalysis) • Identified common features and used them as criteria to construct a climatology • May–September, 2000–2009
ALTs – Common Low-Level Features MSLP (black, hPa), 1000–850-hPa thickness (fills, dam), 10-m winds (barbs, kt) 1800 UTC Composite (N=13)
ALTs – Common Low-Level Features MSLP (black, hPa), 1000–850-hPa thickness (fills, dam), 10-m winds (barbs, kt) 1800 UTC Composite (N=13)
ALTs – Common Low-Level Features Winds orthogonal to mountains MSLP (black, hPa), 1000–850-hPa thickness (fills, dam), 10-m winds (barbs, kt) 1800 UTC Composite (N=13)
ALTs – Common Low-Level Features Thermal ridge Winds orthogonal to mountains MSLP (black, hPa), 1000–850-hPa thickness (fills, dam), 10-m winds (barbs, kt) 1800 UTC Composite (N=13)
Domain for Climatology WIND ZONE ALT ZONE DOMAIN
Methodology for Climatology • Climatology was based on the following three criteria: • 925-hPa Wind Direction • Checked for wind component directions orthogonal to and downslope of Appalachians • Appalachians in the Mid-Atlantic are oriented ~ 43° right of true north • Satisfactory meteorological wind directions exist between 223° and 43° WIND ZONE ALT ZONE • Criterion: wind direction computed from zonal average of wind components along each 0.5° of latitude within Wind Zone must be between 223° and 43° DOMAIN
Methodology for Climatology • Climatology was based on the following three criteria: • MSLP Anomaly • Averaged MSLP along each 0.5° of latitude within domain • Checked for minimum MSLP along each 0.5° of latitude within ALT Zone WIND ZONE ALT ZONE • Criterion: difference of minimum and zonal average MSLP must be less than −0.75 hPa DOMAIN
Methodology for Climatology • Climatology was based on the following three criteria: • 1000–850-hPa layer-mean temperature anomaly • Averaged 1000–850-hPa layer-mean temperature along each 0.5° of latitude within domain • Checked for maximum 1000–850-hPa layer-mean temperature along each 0.5° of latitude within ALT Zone WIND ZONE ALT ZONE • Criterion: difference of maximum and zonal average 1000–850-hPa layer-mean temperature must be greater than 1°C DOMAIN
Methodology for Climatology • The three criteria must be met for six consecutive 0.5° latitudes • An algorithm incorporating the three criteria was run for the length of the climatology at 6-h intervals (0000, 0600, 1200 and 1800 UTC) • ALTs identified by this algorithm were manually checked for false alarms (e.g., frontal troughs, cyclones, large zonal pressure gradients)
Climatology – Results • ALT recorded 26.6% of the time throughout the climatology MSLP anomaly < −0.75 hPaTemperature anomaly > 1°C
Climatology – Results • ALT recorded 26.6% of the time throughout the climatology MSLP anomaly < −0.75 hPaTemperature anomaly > 1°C • Over 75% of ALTs occur in June, July and August • Nearly 66% of ALTs occur at 1800 or 0000 UTC • The seasonal and diurnal heating cycles likely play a role in ALT formation
Outline • Climatology of Appalachian lee troughs (ALTs) • Categorization scheme for ALTs • Spatial frequency of storm reports by ALT category • Summary of key points
ALT Categories • ALTs can be grouped into four categories based on their relationship with synoptic-scale cold fronts • ALTs that occur in advance of cold fronts can be considered prefrontal troughs (PFTs) • Categories: • Inverted • No PFT: Non-prefrontal • PFT, partial FROPA: Prefrontal without frontal passage through entire ALT Zone • PFT, total FROPA: Prefrontal with frontal passage through entire ALT Zone
ALT Categories – Examples • Inverted – trough extends northward from south of the ALT Zone 0000 UTC 31 May 2001 MSLP (black, hPa) and 1000–850-hPa thickness (fills, dam)
ALT Categories – Examples • No PFT – trough occurs in the absence of a synoptic cold front 0000 UTC 10 July 2000 MSLP (black, hPa) and 1000–850-hPa thickness (fills, dam)
ALT Categories – Examples • PFT, partial FROPA • Front must be south of the NY/PA border or east of the western third of PA • Front does not pass through entire ALT Zone 0000 UTC 3 June 2000 MSLP (black, hPa) and 1000–850-hPa thickness (fills, dam)
ALT Categories – Examples • PFT, total FROPA • Front must be south of the NY/PA border or east of the western third of PA • Front passes through entire ALT Zone within 24 h 1800 UTC 13 May 2000 MSLP (black, hPa) and 1000–850-hPa thickness (fills, dam)
ALT Categories – Relative Frequency • Category 2 (No PFT) occurs most frequently
ALT Categories – Relative Frequency • Category 2 (No PFT) occurs most frequently • PFTs account for 44.8% of ALTs
ALT Categories – Monthly Distribution • Category 2 and 3 are more common in JJA, while category 4 is more common in May and September • Stronger westerlies, more FROPA during “transition months”
Outline • Climatology of Appalachian lee troughs (ALTs) • Categorization scheme for ALTs • Spatial frequency of storm reports by ALT category • Summary of key points
Spatial Frequency of Storm Reports by Category – Methodology • Severe local storm reports were obtained from the NCDC Storm Data publication • Included all tornado, severe thunderstorm wind and severe hail (> 1in) for May–September, 2000–2009 ALT ZONE
Spatial Frequency of Storm Reports by Category – Methodology • “Clustering” – attempt to control for population bias in Storm Data • Overlay a 0.5° by 0.5° grid box over the domain • If a storm report occurs within a certain grid box, that grid box is considered “active” • Any subsequent storm reports occurring within the active box are discarded within a 6-h period • The number of active grid boxes for each 6-h period are tallied to measure the spatial extent of severe weather • 6-h periods begin at 0000, 0600, 1200, and 1800 UTC
Spatial Frequency of Storm Reports by Category Percentage of 6-h periods with at least one active grid box Category 3 (PFT, partial FROPA; N=599) Category 2 (No PFT; N=827)
Spatial Frequency of Storm Reports by Category Percentage of 6-h periods with at least one active grid box Category 3 (PFT, partial FROPA; N=599) Category 2 (No PFT; N=827) • Distribution within ALT Zone is similar
Spatial Frequency of Storm Reports by Category Percentage of 6-h periods with at least one active grid box Category 3 (PFT, partial FROPA; N=599) Category 2 (No PFT; N=827) • Distribution within ALT Zone is similar • Difference lies in areas NW of ALT Zone
Spatial Frequency of Storm Reports by Category Percentage of 6-h periods with at least one active grid box Category 4 (PFT, total FROPA; N=130) Category 1 (Inverted; N=73)
Spatial Frequency of Storm Reports by Category Percentage of 6-h periods with at least one active grid box Category 4 (PFT, total FROPA; N=130) Category 1 (Inverted; N=73) • South half of ALT Zone favored in Category 1
Spatial Frequency of Storm Reports by Category Percentage of 6-h periods with at least one active grid box Category 4 (PFT, total FROPA; N=130) Category 1 (Inverted; N=73) • South half of ALT Zone favored in Category 1 • Proportionally more storm reports near the coast in Category 4 than 2 or 3
Spatial Frequency of Storm Reports by Category Percentage of 6-h periods with at least one active grid box Category 4 (PFT, total FROPA; N=130) Category 1 (Inverted; N=73) • South half of ALT Zone favored in Category 1 • Proportionally more storm reports near the coast in Category 4 than 2 or 3 • Maximum in Category 4 from DCA–PHL
Category 4: PFT, Total FROPA Cat 4 (N=130) Percentage of 6-h periods with at least one active grid box
Category 4: PFT, Total FROPA Cat 4 (N=130) • Plume of high CAPE is collocated with 30–35 kt of shear in northern ALT Zone • Collocation of high CAPE and shear values suggest that category 4 severe events may favor the DCA–PHL corridor Cat 4 (N=17) Percentage of 6-h periods with at least one active grid box Composite of 17 days with most active grid boxes Surface to 500-hPa bulk shear (black, kt), MUCAPE (fills, J/kg)
Category 3 and Category 4 Comparison • Higher shear in category 4 severe composites suggest severe events are more organized Cat 3 (N=17) Cat 4 (N=17) Composite of 17 days with most active grid boxes Surface to 500-hPa bulk shear (black, kt), MUCAPE (fills, J/kg)
Outline • Climatology of Appalachian lee troughs (ALTs) • Categorization scheme for ALTs • Spatial frequency of storm reports by ALT category • Summary of key points
Summary – Key Points • ALTs form preferentially during diurnal and seasonal heating maxima
Summary – Key Points • ALTs form preferentially during diurnal and seasonal heating maxima • Frequency of each ALT category varies by month • Category 2 and 3 are more common in JJA, while category 4 is more common in May and September • Stronger westerlies, more FROPA during “transition months”
Summary – Key Points • ALTs form preferentially during diurnal and seasonal heating maxima • Frequency of each ALT category varies by month • Category 2 and 3 are more common in JJA, while category 4 is more common in May and September • Stronger westerlies, more FROPA during “transition months” • Spatial distribution of storm reports varies by ALT category • Category 2 and 3 have similar distributions within ALT Zone • Category 4 favors DCA–PHL corridor, linked to collocated high CAPE and shear
Contact Information Dan Thompson dthompson@albany.edu http://www.atmos.albany.edu/student/dthompso/
Climatology – Results ← Stricter ← Stricter • Each bubble denotes the percentage of time an ALT is recorded under a particular set of MSLP/temperature anomaly constraints • Boxesindicate the criteria adopted as the ALT definition
Spatial Frequency of Storm Reports by Category – Methodology • Storm reports were binned based on nearest earlier ALT category present • Example: Category 2 ALT occurred at 1800 UTC • Storm reports occurring from 1800 to 2359 UTC fall into the category 2 bin