Download
1 / 24
240 likes | 425 Vues
PEAT, PULP AND PAPER: Climate Impact of Pulp Tree Plantations on Peatland in Indonesia. PROFESSOR JACK RIELEY University of Nottingham, UK Ramsar Scientific Technical Review Panel International Peat Society Orang Utan Foundation UK. AREA OF PEATLAND IN INDONESIA. Sumatra 8.3 M ha

E N D
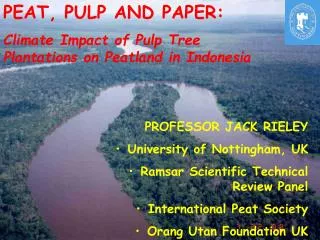
PEAT, PULP AND PAPER: Climate Impact of Pulp Tree Plantations on Peatland in Indonesia • PROFESSOR JACK RIELEY • University of Nottingham, UK • Ramsar Scientific Technical Review Panel • International Peat Society • Orang Utan Foundation UK
AREA OF PEATLAND IN INDONESIA Sumatra 8.3 M ha Kalimantan 6.8 M ha West Papua 4.6 M ha Approximately 50% (~20 M ha) of tropical peatland occurs in Indonesia A further 2.8 M ha occurs in Peninsular Malaysia and northern Borneo (Sarawak, Brunei)
Characteristics of Lowland Peatlands in Southeast Asia • Support a natural vegetation of peat swamp forest. • Acidic, rain-fed, nutrient-poor systems. • Thick organic layer – peat thickness can exceed 10m. 12 m
Biodiversity • Tree species recorded from peat swamp forests in SE Asia: ~ 800 tree species ~ 71 families ~ 237 genera • Many display characteristic adaptations to the habitat, e.g. stilt roots, pneumatophores.
Biodiversity Mammalian fauna includes several notable species: orang-utan agile gibbon sun bear Pongo pygmaeus pygmaeus
CARBON SEQUESTRATION AND STORAGE • In tropical peatlands the vegetation and underlying peat constitute a large and highly concentrated carbon store • Estimates of current carbon accumulation rates in tropical peatlands range from 59-145 g m-2 yr-1sequestering between0.06–0.093 Pg C yr-1 • Some peatlands, even in a natural condition, are in a steady-state and are no longer accumulating peat, whilst others are undergoing degradation • The peatlands of Kalimantan represent a carbon store of 13 Pg, those of Indonesia contain 35 Pg and the global total for tropical peatlands is estimated to be 54 Pg
FORMER MEGA RICE PROJECT SEPTEMBER 2002 There have been some problems!
Two years after MRP commenced :1997 El Niño promoted widespread forest fires Peatland fires were widespread in Kalimantan and Sumatra
Carbon Emissions from Peatland Fires Carbon losses from Indonesian peatland fires during 1997/98: • Estimated 0.81 – 2.57 Gt C[Page et al. 2002] ~ 55-95% of C emissions from all fires during that period in SE Asia[Schimel & Baker 2002; van der Werf et al. 2004, 2006] Annual fire hotspot data for Borneo 1997 to 2006 [Langner et al. 2007]
“Haze” from the forest/peatland fires blankets much of SE Asia - Sept. 1997(NASA satellite image)
Sink to Source • Carbon storage : • Above-ground ~150 - 250 t C ha-1 • Below-ground ~250 - >5,000 t C ha-1 • Carbon sequestrationseverely impaired by land use change • 120,000 km2(45%) currently deforested & mostly drained • Large areas impacted by recurrent fires • Drivers of land use change: • Conversion to plantations (palm oil/Acacia) • Logging (illegal logging rampant in Indonesia) • Poor forest and (peat)land management • Lack of understanding of peatlands and peat
Modelling Carbon Emissions from Drained Tropical Peatlands Current (2005): 355-874 Mt CO2 yr-1 (100–240 Mt C yr-1 ) Projected (2015-2035): 557-981 Mt CO2 yr-1 (150-270 Mt C yr-1 ) Drainage emissions are equivalent to 1.4–3.5 % of global emissions from fossil fuels (25,000 Mt CO2yr-1) [Hooijer, Silvius, Wosten & Page, 2006]
Carbon Emissions from Drained Peatlands Oil palm plantation 2.3 m loss 1976-2007
Improved plantation water management Reduced emissions/subsidence Linked to protection of remaining natural forest
Reducing the contribution tropical peatlands make to C emissions • Reduce emissions from remaining forests = deforestation avoidance – need for baseline & monitoring data • Reduce emissions fromdegraded peatlands = hydrological restoration and reforestation – pilot studies • Improve understanding of vulnerability of plantations on peatlands = e.g. improved plantation water management (best practice examples) • Transfer/disseminate scientific knowledge to influence public policy-making
WISE USE STRATEGIES FOR WISE USE OF TROPICAL PEATLAND IN INDONESIA
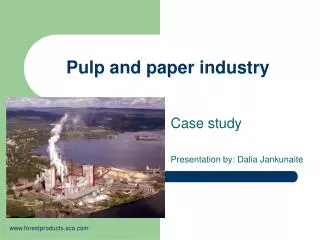
LIFE CYCLE COMPARISONS ON TROPICAL PEATLAND The impact of different land uses on tropical peatland in Indonesia (oil palm and pulp tree plantations) on CO2e emissions compared to natural, peat swamp forest and deforested, drained and degraded peatland.
DATA, METHODS AND ASSUMPTIONS We use data from both primary and secondary sources to estimate the likely magnitude of the inputs to and outputs from tropical peatland carbon stores under different land uses and the changes that will take place to these stores over a period of 25 years representing the average economic life of an oil palm plantation (Corley & Tinker, 2003). Our focus is on carbon dioxide (CO2). Methane emissions from tropical peatland under all land uses is very low (Jauhiainen, 2005, Melling, 2005) while emissions of other greenhouse active gases, notably NO2, have not been studied in detail so far and are not included in this assessment.
TROPICAL PEAT LAND USE CARBON BUDGETS (calculated for a 25 year period – t C ha-1)
TROPICAL PEAT LAND USE CARBON BUDGETS (calculated for a 25 year period – t C ha-1)
ENDWORD The four land use scenarios are benchmarked to specific assumptions and conditions and are indicative only. For example the major assumptions of peat thickness of 4.4 m, bulk density of 0.09 g cm-3 and carbon content of 56% are the best estimates available at present and are obtained from detailed field sampling and analysis of peat cores. Of course not all tropical peat will have exactly these values and when data from other locations for similarly long, intact peat cores become available the model depicted in this paper can be updated. The comparisons, however, will remain valid.
STRAPEAT WISE USE RESTORPEAT Thank you for listening. Time is running out!! Bio-rights