Exploring Data
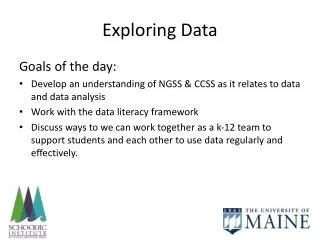
Lecture 3 of Stat 111 focuses on numerical summaries for one-variable data. Key topics include the center of a distribution, specifically the mean and median, along with the effects of outliers and asymmetry. Students will learn about measures of spread, such as standard deviation and interquartile range (IQR), and how these metrics respond to extreme values. Practical examples illustrate these concepts, including the relevance of trimming to mitigate the influence of outliers. This session is essential for foundational statistical analysis.


Exploring Data
E N D
Presentation Transcript
Statistics 111 - Lecture 3 Exploring Data Numerical Summaries of One Variable Stat 111 - Lecture 3 - Numerical Summaries
Administrative Notes • Homework 1 due on Monday • Make sure you have access to JMP • Don’t wait until the last minute; I don’t answer last minute email • Email me if you have questions or want to set up some time to talk: braunsf@wharton.upenn.edu • Office hours today 3-4:30PM Stat 111 - Lecture 3 - Numerical Summaries
Outline of Lecture • Center of a Distribution • Mean and Median • Effect of outliers and asymmetry • Spread of a Distribution • Standard Deviation and Interquartile Range • Effect of outliers and asymmetry Stat 111 - Lecture 3 - Numerical Summaries
Measure of Center: Mean • Mean is a list of numbers, is simply the arithmetic average: • Simple examples: • Numbers: 1, 2, 3, 4, 10000 Mean = 2002 • Numbers: –1, –0.5, 0.1, 20 Mean = 4.65 Stat 111 - Lecture 3 - Numerical Summaries
Problems with the Mean • Mean is more sensitive to large outliers and asymmetry than the median • Example: 2002 income of people in Harvard Class of 1977 • Mean Income approximately $150,000 • Yet, almost all incomes $70,000 or less! • Why such a discrepancy? Stat 111 - Lecture 3 - Numerical Summaries
Potential Solution: Trimming the Mean • Throw away the most extreme X % on both sides of the distribution, then calculate the mean • Gets rid of outliers that are exerting an extreme influence on mean • Common to trim by 5% on each side, but can also do 10%, 20%, … Stat 111 - Lecture 3 - Numerical Summaries
Measure of Center: Median • Take trimming to the extreme by throwing away all the data except for the middle value • Median = “middle number in distribution” • Technical note: if there is an even number of obs, median is average of two middle numbers • Simple examples: • Numbers: 1, 2, 3, 4, 10000 Median = 3 • Numbers: -1, -0.5, 0.1, 20 Median = -0.2 • Median is often described as a more robust or resistant measure of the center Stat 111 - Lecture 3 - Numerical Summaries
Examples • Shoe size of Stat 111 Class Mean = 8.79 Median = 8.5 • J.Lo’s Dates in 2003 Mean = 5.86 Median = 5 Stat 111 - Lecture 3 - Numerical Summaries
Top 100 Richest People (Forbes 2004) Mean = 9.67 billion Median = 7.45 billon Stat 111 - Lecture 3 - Numerical Summaries
Effect of outliers Stat 111 - Lecture 3 - Numerical Summaries
Effect of Asymmetry • Symmetric Distributions • Mean ≈ Median (approx. equal) • Skewed to the Left • Mean < Median • Mean pulled down by small values • Skewed to the Right • Mean > Median • Mean pulled up by large values Stat 111 - Lecture 3 - Numerical Summaries
Measures of Spread: Standard Deviation • Want to quantify, on average, how far each observation is from the center • For observation , deviation = • The variance is the average of the squared deviations of each observation: • The Standard Deviation (SD): • Why divide by n-1 instead of n? Don’t ask! Stat 111 - Lecture 3 - Numerical Summaries
Sensitivity to outliers, again! • Standard Deviation is also an average (like the mean) so it is sensitive to outliers • Can think about a similar solution: start trimming away extreme values on either side of the distribution • If we trim away 25% of the data on either side, we are left with the first and third quartiles Stat 111 - Lecture 3 - Numerical Summaries
Measures of Spread: Inter-Quartile Range • First Quartile (Q1) is the median of the smaller half of the data (bottom 25% point) • Third Quartile (Q3) is the median of the larger half of the data (top 25% point) • Inter-Quartile Range is also a measure of spread: IQR = Q3 - Q1 • Like the median, the Inter-Quartile Range (IQR) is robustor resistant to outliers Stat 111 - Lecture 3 - Numerical Summaries
Detecting Outliers • IQR often used to detect outliers, like when a boxplot is drawn • An observation X is an outlier if either: • X is less than Q1 - 1.5 x IQR • X is greater thanQ3 + 1.5 x IQR • This is an arbitrary definition! • some outliers don’t fit definition, some observations that do are not outliers • Note: if the data don’t go out that far then the whiskers stop before 1.5xIQR Stat 111 - Lecture 3 - Numerical Summaries
Examples of Detecting Outliers Stat 111 - Lecture 3 - Numerical Summaries
What to use? • In presence of outliers or asymmetry, it is usually better to use median and IQR • If distributions are symmetric and there are no outliers, median and mean are the same • Mean and standard deviation are easier to deal with mathematically, so we will often use models that assume symmetry and no outliers • Example: Normal distribution Stat 111 - Lecture 3 - Numerical Summaries
Next Class - Lecture 4 • Exploring Data: Graphical summaries of two variable • Moore, McCabe and Craig: Section 2.1 Stat 111 - Lecture 3 - Numerical Summaries