Download
1 / 3
30 likes | 130 Vues
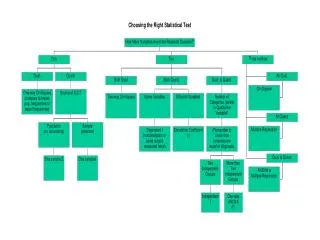
Learn how to choose the right variables for a student engagement survey using examples from a national survey. Explore demographics, student opinions, and research questions. Understand when to accept or reject null hypotheses with supporting statistics. Discover implications for future research.

E N D
Examples of Choosing the Right Test Variables Available (examples from National Survey of Student Engagement) • Demographics: • gender, major, year-in-school… • Answers to: • How much has this college contributed to your acquiring work-related knowledge or skills (very much, quite a bit, some, very little) • Quality of academic advising (excellent, good, fair, poor) • If starting over, would you go to this college? (definitely yes, probably yes, probably no, definitely no) • Answers to: • Hours per week spent on preparing for class (0 to >= 30) • Exams challenge me to do my best work (1= very little, 7 = very much) • Quality of relationships with administrative personnel & offices (1 = unhelpful, inconsiderate, rigid, 7 = helpful, considerate, flexible) Research Questions • Proportion of year-in-school in sample compared to known FLC proportions (one-way chi-square) • Mean hours spent preparing for class compared to known national mean & national SD (one-sample Z) • Mean admin. relationship score compared to FLC criterion of 6.0 (SD from sample) (one-sample t) • Opinions about quality of advising for students in different years-in-school (two-way chi-square) • Hours/wk. preparing for class measured for each subject in Sept. and again in April (dependent t) • Relationship between hours/wk. preparing for class and challenge level of exams (correlation) • Gender differences in hours/wk. preparing for class (independent t) • Major differences in hours/wk. preparing for class (one-way ANOVA) • Prediction of “would you choose this college again” via combination of all the other variable (multiple regression)
Null Rejected Answer research question (yes, this study does appear to …..) Provide supporting statistics (test, df, computed value, most impressive p-value, effect-size) Provide supporting descriptive statistics (means & SDs or frequencies & percents). Direct attention to where the major differences/effects seem to be Provide confidence intervals and/or results of post-hoc tests Discuss any concerns about Type I error (false alarm) Discuss directions for future research Null Retained Answer research question (no, this study does not appear to ….) Provide supporting statistics of no reliable difference or effect (test, df, computed value, p-value, effect size) Provide supporting descriptive statistics (means & SDs or frequencies & percents). Remember the conclusion of no reliable difference/effect Consider reporting confidence interval (to emphasize conclusion of “no reliable difference” or to introduce Type II error discussion) Discuss any concerns about Type II error (missed effects) Discuss directions for future research Components of Interpretation