Download
1 / 15
410 likes | 1.29k Vues
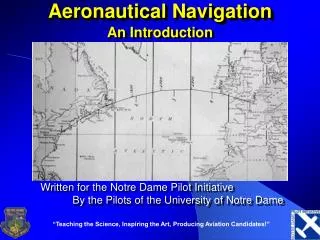
Navigation Aeronautical Charts. Reference. From the Ground Up Chapter 7.4: Aeronautical Charts Pages 186 - 196. Introduction. Aeronautical charts are maps that show important information for air navigation. Pilots need to know what kind of charts are available and how to read them.

E N D
Reference From the Ground Up Chapter 7.4: Aeronautical Charts Pages 186 - 196
Introduction • Aeronautical charts are maps that show important information for air navigation. • Pilots need to know what kind of charts are available and how to read them.
Outline • Distance and Speed Units • Aeronautical Charts • Chart Types • Scale and Relief
Distance Units • Statute Mile (SM or Mi) = 5280 feet • Nautical Mile (NM) = 6080 feet = one minute of latitude • Kilometer (km) = 1000 meters • 66 NM = 76 SM = 122 km
Speed Units • Miles per Hour (MPH) = statute miles per hour • Knots = nautical miles per hour • Kilometers per hour (km/h)
Speed Units • Indicated Airspeed = speed on airspeed indicator • True Airspeed = Speed of aircraft relative to air • Groundspeed = Speed of aircraft relative to ground
Aeronautical Charts • A Mapis a small-scale, flat-surface representation of a part of the earth’s surface • When designed for navigational information, it is called a Chart • Four basic elements in map construction: • Areas • Shapes • Bearings • Distances • Mathematical basis on which maps are constructed are called projections; They show distortion because Earth is a sphere
Conic Projection • Lambert Conformal Conic Projection • Cone superimposed over surface of a sphere; imprint made from where cone touches surface • Properties • Meridians converge toward nearer pole • Parallels are curves and concave toward nearer pole • Scale is constant • Straight line is an arc of a great circle
Mercator Projection • Visualized as light shown from inside earth onto cylinder touching equator • Properties • Meridians and parallels are straight and parallel • No constant scale • Straight line on map is a rhumb line • Extreme exaggeration of areas in far north and south • Distances near equator are more precise • Transverse Mercator • Cylinder rotated 90 degree to touch a meridian • Exaggeration at east and west areas • More accurate because closest meridian can be used
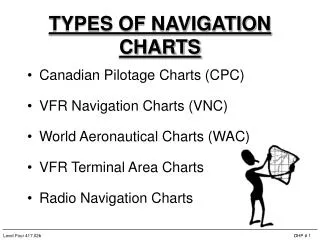
Chart Types • VFR Navigation Charts (VNC) • Lambert Conformal Conic Projection • 1:500,000 scale • World Aeronautical Charts (WAC) • Lambert Conformal Conic Projection • 1:1,000,000 scale • VFR Terminal Area Charts (VTA) • Transverse Mercator Projection • 1:250,000 • Only made for high-traffic areas
Chart Types • Enroute Charts (LO/HI) • Enroute Low Altitude (LO) for below 18,000 ft • Enroute High Altitude (HI) for above 18,000 ft • Used for IFR • Canada Flight Supplement (CFS) • Lists all aerodromes shown on VNC/WAC • Contains valuable information (runways, aerodrome lighting, services, radio frequencies etc)
Scale • Relationship between unit of distance on map to distance on earth that unit represents • Representative Fraction • Most common method of expressing map scale • Ratio of unit of length of map to number of same units on earth • Graduated Scale • Line drawn on part of map and graduated to show length of one mile on map
Relief • Representation of ground elevation above sea level • Ways of showing relief: • Layer Tinting • Contour Lines • Spot Heights
Next Lesson 6.1 – Radio Radio From the Ground Up Chapter 8.1: Radio Pages 209 - 213