Analysis Of Food
881 likes | 1.71k Vues
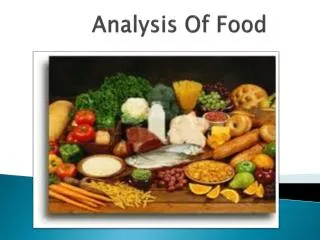
Analysis Of Food. 1-Introduction. Food analysis is the discipline dealing with the development, application and study of analytical procedures for characterizing the properties of foods and their constituents Characteristics of food, include their composition

Analysis Of Food
E N D
Presentation Transcript
1-Introduction • Food analysis is the discipline dealing with the • development, application and study of analytical • procedures for characterizing the properties of foods and their constituents • Characteristics of food, include their composition • structure and physicochemical properties • Food components e.g. lipids, proteins, water, • carbohydrates and minerals
2- Food Safety -one of the most important reasons for analyzing food to ensure that they are safe -Food considered to be unsafe because it may contains: 1- harmful micro organisms (Salmonella) . 2- toxic chemicals (pesticides). 3- extraneous matter(glass, wood, metal, insects and matter) So analytical techniques must be of high sensitivity to detect low levels of harmful material
Properties Analyzed 1- Composition: a- most foods are compositionally complex material Made up of a variety of different chemical constituents b- Composition depends upon the property that is of interest to the analyst e.g.: specific atoms :C,H,N,O,S,Na,…etc specific molecules : water, sugar,…. Specific substances : milk, flour, butter,…. Types of molecules : fats, proteins, carbohydrates, minerals
2-Structure a- Molecular structure(~1-100nm) type of molecules present b- Microscopic structure (~10nm-100 μ m) food can be observed by microscopy (not by unaided eye) eg emulsion droplets, fat crystals, protein aggregates,... c- Microscopic structure (~> 100 μm) food can be observed by the unaided eye) eg sugar granules , raisons, chocolate chips food….
Thus food must be carefully designed so that they have the required physicochemical properties over range of environmental conditions and Analytical techniques are needed to test physicochemical properties
Food components: can be distinguished from each other by • Molecular Characteristics: size ,shape, polarity, interaction with radiation,…. • physical properties: melting points, boiling points, density,…. • Chemical reaction: Specific chemical reaction between certain component and an added reagent
3- Selecting an Appropriate Technique Some of the criteria that are important in selecting a technique are: precision Accuracy Cost Simplicity of operation Reproducibility Sensitivity Speed destructive /Nondestructive safety
Specify : a measure of ability to detect and quantify a specific components within a food material even in the presence of other similar components eg fructose in presence of sucrose or glucose
4- Sample Selection and Sampling A food analyst has to select an appropriate fraction of the whole material which is one of the most important stages of food analysis , and can lead to large errors when not carried out correctly
5-Prepartion of Laboratory Samples 5. 1- Making Samples Homogeneous 1- Mechanical devices e.g., grinder, mixers ,slicers , blenders 2-Enzymatic method e.g., professes, calluses, lipases 3- chemical methods e.g., strong acid , strong bases.
5.2-Reducing Sample Size and Preventing Changes in sample Enzymatic Inactivation Lipid Protection Microbial Growth and Contamination Physical changes
Analysis of Proteins • Proteins are polymers of amino acid • Twenty different type f amino acid occur naturally in proteins. • Proteins differ from each other according to number and sequence of amino acid that makes up polypeptide backbone • Thus proteins have different molecular structure
Proteins are important constituents of food, they are major source of energy. • Proteins are major structural component of many natural food e.g. meat or fish product • Protein are used as galling agent, emulsifiers, foaming agent . • Many food proteins are enzymes which are capable of enhancing the rate off certain biochemical reaction • Food analysis are interested in knowing the total concentration ,type, molecular structure, and functional properties of proteins in food
Proteins Amino acids are the basic structural units of proteins. An amino acid is a compound that contains at least one amino group(-NH2) and at least one carboxyl group (-COOH)
Protein structure Carbon(black) Nitrogen (blue)Oxygen (red)R-Group(green)Hydrogen (gray)
7-Determination Of Overall Proteins Concentration 7.1-Kjeldahl Method 1- Food is digested with strong acid (H2SO4) to oxidize any nitrogen in the oxidation state -3 to NH4SO4 N(food) (NH4) 2SO4 2- HgO is added as a catalyst to ensure complete oxidation.
3- Nitrogen in oxidation states other than -3 (nitro, azo- are oxidation to N2 resulting an error , salicylic acid is added as a reducing nitrogen to -3 state. 4- The ammonium sulphate is then converted into ammonia gas by heating with sodium hydroxide (NH4)2SO4+2NaOH Na2SO4+2H2O+2NH3
5-NH3 is collected in a flask containing a known amount of standard HCL. 2NH3+2HCL 2(NH4)CL 6-The excess HCL is then titrated with standard NaOH 1 Mole HCL=1Mle N=14 gN 7-A blank sample is usually run at the same time as the material being analyzed to into account ay residual nitrogen take may be present into the reagent used to carry out the analysis. 8- the continent of protein is equivalent to the amount of nitrogen found
NХF %protein =% F= conversion factor =100( % Nin food protein) A conversion factor of 6.25(equivalent to 0.16g nitrogen per gram of protein) is used for many application this is an average value, each protein has a different conversion factor depending on its amino-acid composition
Table (1):Specific Jones factor for the conversion of nitrogen content (selected food)
7.2- spectroscopic methods of proteins analysis 1- Methods using UV-visible spectroscopy 2- Infrared spectroscopy : near infrared (NIR)λ region is 800-2500nm, it penetrates deeper into the food sample giving a more reprehensive analysis. 3- NMR Spectroscopy : protein content by measuring area under a peak in a NMR chemical shift spectra that correspond to the protein fraction.
Method using UV - vis spectroscopy 1-these methods use either the natural ability of proteins to absorb (or scatter) light in the UV-Vis reason of the electromagnetic spectrum or They chemically or physically modify proteins to make them absorb or scatter light in this reason 2- Calibration curve of absorbance or turbidity verses protein consecration
7.3-Measurement of Physical Properties Density The density of a protein is greater than that of the most other food components, and so there is an increase in density of a food as its protein content increase. Refractive Index The refractive index of an aqueous solution increases as the protein concentration increases
8- protein separation and characterization 1-Separation due to Different Adsorption characterization Ion exchange chromatography . 2-Separation due to size difference . Size exclusion chromatography 3- Separation by electrophoresis
9- Metal in foodTin Zinc Arsenic Copper These metals can be determine gravimetrically or by atomic absorption methods.
9-1 MERCURY IN FOOD PRODUCT Mercury in mushroom Mercury in fishes
1- fish is an important part of a healthy diet 2- benefits of fish: high in protein, law in saturated fat and high in unsaturated fat 3- most people are exposed to mercury via food 4- fish takes up mercury from steams and oceans as they feed, this mercury is the most toxic form ,methyl mercury. It binds to there tissue protein (muscles)
5- there are three forms of mercury : organic ,inorganic and metallic. 6-organic form I dangerous (methyl mercury) . 7- inorganic mercury is converted to organic mercury by anaerobic bacteria at the bottom of lakes streams 8- small aquatic animals consumes the organic mercury, and in turn eaten by larger life form. 9-as the elements move up to the food chain , forms microbes to the fish then to large animal as swordfish, mercury becomes more concentrated.
10- oysters may concentrate mercury by a factor of 100,000. 11-mercury levels differs from one species of fish to the next , according to fish, size, location, habitat and age. 12- fish contains higher levels of mercury includes , shark , swordfish , barramundi,… 13- fish contains lower levels of Mercury includes, lobster, salmon and canned tuna.
9.1.1 Analysis of mercury in fish 1. Atomic Absorption Methods 2. Dithizone Colorimetric Procedure 3. Neutron Activation Analysis
Dithizone Colorimetric Procedure 1- It is the most commonly used method. 2- wet oxidation process. 3- Hydroxylamine hydrochloride is added to reduce the remaining oxidizing material from wet oxidization. 4-Mercury is extracted from solution using Dithizone in chloroform. 5- Copper can interact with thiazone causing interference
6- Sodium thiosulfate is added to the CHC13 layer, a water soluble mercury thiosulfate is formed while copper Dithizone remains in CHC13 7- The aquophase containing mercury-thiosulfate is again oxidizes by H2SO4 or HNO3 and mercury is extracted with in CHC14 8- Mercury – dithionate is determined spectrophotometrically at 490nm
“Advantages”: Low cost, simplicity, senility.= “Disadvantages”: Interference of copper.
Ffffffffffffffffff 10-carbohydrates in food Total carbohydrate content of food is calculated by difference ,rather than analyzed directly . Thus the constituents in food (proteins, fats water, ash, alcohol) are determined individually , summed and subtracted from total weight of the food. Total cryohydrate = 100(weight in grams(protein, fat, water, ash, alcohol) in 100 grams of food
11-Separation and identification of sugars A- Paper chromatography b- high performance liquid chromatography Example separation of fructose , orbital ,scarce and lactose 1- fructose 2- orbital 3- scarce 4- lactose
12- fats in food Fats are hydrolyzed using an alkali such as(NaOH), the alcohol is liberated and also salts of fatty acids (soaps)
1- Fats become rancid as a result of peroxide formation at the double bonds by atmospheric oxygen and hydrolysis by micro organisms with the liberation of free acids. 2- The amount of free acids presents gives an indication of the age and quality of fats 3- Acids value :is the number of milligrams of KOH requires to neutralize the free acid present in 1gm fat.
12.1 Separation and Charactration of Free Fatty Acids From Milk 1-The milk sample is prepared by mixing 10ml of milk 10ml, of 28%ammonium hydroxide, 25 ml petroleum ether and 25ml diethyl ether.
2-when the mixture is well shaken it allows to stands 20 min, the residue is treated with 3ml 0.5N NaOH in methanol, heated on a stream bath 15 min. 3- 5ml water is added then 2N HCL till pH is about 2 is reached. 4- Separation was carried out using Gas Chromatographic (G . C) method.
5- Glass column , 3m long , 2mm diameter, packed with silicon polymer. 6- The column is then programmed from 130-200 ˚C Nitrogen is used as carrier gas. 7- This method is effective, rapid, accurate quantitative results were easily obtained