Download
1 / 44
440 likes | 507 Vues
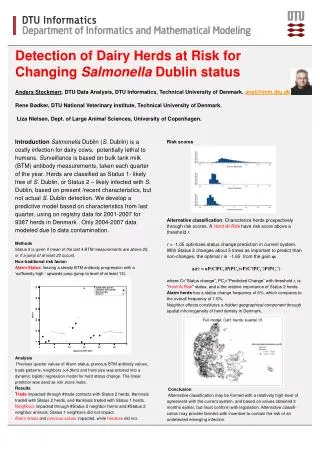
Detection of Dairy Herds at risk for changing Salmonella Dublin status. Symposium in Applied Statistics 2012 Anders Stockmarr DTU Data Analysis Technical University of Denmark anst@imm.dtu.dk Rene Bødker , DTU National Vet. Inst. Liza Nielsen , Dept. of Large Animal Sciences,

E N D
Detection of Dairy Herds at risk for changing Salmonella Dublin status Symposium in Applied Statistics 2012 Anders Stockmarr DTU Data Analysis Technical University of Denmark anst@imm.dtu.dk Rene Bødker, DTU National Vet. Inst. Liza Nielsen, Dept. of Large Animal Sciences, Univ. of Copenhagen
Background Salmonella Dublin (S. Dublin) is a specific serotype of the Salmonella bacterium S. Dublin is host-adapted to cattle, and the most prevalent serotype found in cattle in Denmark (~60-70% of all isolates) S. Dublin is a rare but serious zoonosis that causes severe disease and deaths in humans every year (10-40 hospitalized cases per year in Denmark). Detecting Dairy Herds
S. Dublin Symptoms Unthrifty calves • Fever • Diarrhoea (bloody) Pneumonia • Death • Abortions Detecting Dairy Herds
The Salmonella Dublin surveillance and eradication programme in Denmark Eradication campaign until 2014 Goal: The Danish cattle population free from Salmonella Dublin in 2014 2010-2012: Sanctions to improve motivation 2013-2014: Veterinary Authorities will handle infected herds through law enforcement Detecting Dairy Herds
The Salmonella Dublin surveillance and eradication programme in Denmark Surveillance program since 2002: Cattle herds are classified as follows, based on Bulk Tank Milk/blood sample antibodies and trade contacts: Level 1: Most likely free from salmonella Level 2: Too high antibody levels or contact to other herds in Level 2 or 3 Level 3: ClinicalSalmonella Dublin diagnosis and culture positive Unknown: Only non-dairy herds with too few samples to classify (hobby herds) Detecting Dairy Herds
The Salmonella Dublin surveillance and eradication programme in Denmark Surveillance program since 2002: Cattle herds are classified as follows, based on Bulk Tank Milk/Blood sample antibodies and trade contacts: Level 1: Most likely free from salmonella Level 2: Too high antibody levels or contact to other herds in Level 2 For the present work we do not distinguish between level 2 and 3 Detecting Dairy Herds
Reasons for assigning Level 1 to dairy herds Salmonella Dublin Level 1 is given if: 1. Valid bulk tank milk antibody measurements exists – and 2. The last 4 bulk tank milk antibody measurements, gathered with at least 3 weeks in between, shows an average ODC-value of less than 25 – and 3. The latest Salmonella Dublin measurement has not shown an increase of more than 20, compared to the average of the three preceding measurements - and A number of circumstances mainly related to trade and missing data do not hold. Otherwise, Salmonella Dublin Level 2 is given. Detecting Dairy Herds
Bulk Tank Milk antibody measurements from dairy herds • Collected routinely every three months. • Thus, a very long period for an infection to develop before a dairy herd is possibly re-classified. • Sanctions and law enforcement gives farmers an incentive to act if they suspect an infection is present. • There is therefore a need to identify herds at risk of changing S. Dublin level, based on information a quarter earlier than re-classification takes place. Detecting Dairy Herds
Risk Herds Are herds ’at risk of’ changing level from 1 to 2; we will start out with this loose definition. Risk herds are thus Level 1 (”Status 1”) herds. Purpose of current study: To determine appropriate definitions for a risk herd, based on available factors one quarter prior to a possible level shift. Detecting Dairy Herds
The probability of changingS. Dublin status If Xi,tdenotes the BTM measurement for herd i at time t, and the mean of the last 3 measurements, then the probability of a status change is given as ie. is modeledthrough a logistic regression: through successive conditioningon the BTM measurements. Detecting Dairy Herds
What makes herds become Risk Herds? - bulk tank milk measurements, trade, neighbors and herd size • Bulk tank milk measurements: • High antibody levels; • Unstable development in measurements. • Trade: • That animals are bought from herds that turn out to be Status 2 herds; • that many animals are bought; • that many herds are traded with. • Neighbors: • That many neighbors areassigned Status 2; • That there are many neighbors. • Size: • That the herd is large. Detecting Dairy Herds
Available Data Quarterly bulk tank milk measurements 2002-2008 for 9397 dairy herds; Geographical coordinates for dairy and non-dairycattle herds and their quarterly S. Dublin level; All perfomed trades at animal level 2002-2008; Data on herd sizes; Only 2004-2008 er usable. Detecting Dairy Herds
BTM measurements and Alarm Herds BTM measurement enter covariates through ; obviously a high level of recent antibody levels will increase the risk of a Status 2 change. But also sudden (upwards) deviations from a stationary development could indicate an emerging infection. BTM measurements also enters through Alarm Herd status: Alarm Herd concept: A Status 1 herd A is an Alarm Herd at a timepoint t0, if BTM measurements for A for at least the previous 4 time points do not vary more than a standard 95% confidence interval would predict, and the BTM measurement for A at time t0 is above this level, and above an upward threshold c > 0. Detecting Dairy Herds
Alarm Herds Alarm Herds are Level 1 herds: The jump from the steady progression should be big (to a level > c),but not so big that it triggers a Status 2 classification. Time points where BTM measurements for A for at least the previous 4 time points do not vary more than a standard 95% confidence interval would predict are called stabletimepoints. When a herd leaves a stable state to become unstable, we say that a jump has occurred. When a herd becomes an Alarm Herd, we say that a risk jump has occurred. Detecting Dairy Herds
A BTM measurement progression example Detecting Dairy Herds
Estimation of c Weincluded Alarm Herd status in the basiclogistic regression model withvaryingvalues of c (integer ODC values), to gain a series of competing models; Wechose the model with the optimal Akaike Information; Consequently, weestimatedc to be 13. Detecting Dairy Herds
Trade information Detecting Dairy Herds
Trade Detecting Dairy Herds
Trade II Detecting Dairy Herds
Trade III Detecting Dairy Herds
Trade IV Detecting Dairy Herds
Neighbor herds and animals Detecting Dairy Herds
Neighbors – What is a neighbor? Ersbøll & Nielsen (2008): 4.9 km is the average ’range of influence’ for localspread of Salmonella. WedefineNeighbors to beherds with a distance of lessthan 4.9 km from the herd in question. Counted for all dairy herds in Denmark, dynamically (ie., a time series). Weconsiderboth the number of herds and the number of animalswithinthis radius. The neighboreffect is a hiddengeographicalcomponent, in thatclusters of herds will have manyNeighbors (wellknownplaces in Jutland). Detecting Dairy Herds
Herd Sizes, dairy herds Detecting Dairy Herds
Herd sizes, non-dairy herds (used as neighborsonly) Detecting Dairy Herds
Dynamic herd sizes, dairy herds Detecting Dairy Herds
Dynamic herd sizes, non-dairy herds Detecting Dairy Herds
Remarks I Noeffect of tradetwoquarters back. Interactionacrossgroups of covariateswithonly. Alarm Herd status (onequarter back) has a large impact; Effect of animals (traded and neighbors) decreaseswhenlevel of increases; thosewith a highlevel of have a risk independent of animalspurchased and animalstraded. Independent of : Trade contactswith Status 2 herds and Alarm Herd status. Detecting Dairy Herds
Remarks II Trade with Status 1 herds has an effectthrough the number of purchasedanimals, whiletradewith Status 2 herds has an effectboththrough the number of trade partners and the number of purchasedanimals. Status 1 tradecontacts is not significant. Neighbors has an effectthroughStatus 2 dairyneighbor farms and Status 2 dairyanimals. Non-dairyneighbours and Status 1 dairyneighborsare not significant. Detecting Dairy Herds
Model basedon 2007 data only Detecting Dairy Herds
Risk Scores Weused the linear predictor as a risk score index. Whichindexvalue is highenough to consider a given herd to be a ’risk herd’, where the farmer shouldinterveneifpossible? Detecting Dairy Herds
Risk Scores – big model Detecting Dairy Herds
Risk Scores – small model Detecting Dairy Herds
Definitions of risk herds A thresholdrthatdefines a herd to be a risk herd if the risk score is > rrepresents a trade-offbetweennumber of herds at risk and the frequencywithwhichtheychange status: Detecting Dairy Herds
Predictive power Coefficients re-estimated based on 2004-2006 data, and used to predict 2007 data: ROC curves when threshold varies Big model Small model Detecting Dairy Herds
Small model versus big model Tempting to choose the simpler model; Predictive power is similar and model is muchlesscomplicated; However, the model could not bereproduced in fullwhenapplied to differentcohorts of the data; we have noexplanation for this. Werecommenduse of the big model. Detecting Dairy Herds
Predictive power and relative importance Threshold is optimizedbasedonpredictive power of the big model as r = -1.05 However, it is much more important to predictthosethatchange status thanthosethat do not. Let αdenotethe importance of predicting a status change correctly relative to a non-change, and let C be the event “change of status”, and PC the event that a herd is classified as a Risk Herd. Instead of optimizing average predictability, we optimise the importance function αP(C|PC)P(PC)+P(C¬|PC¬)P(PC¬) where “ ¬ ” signifies negation. Detecting Dairy Herds
Thresholdvalue as a function of importance Detecting Dairy Herds
Suggestedestimation of αbasedon farmer incentive Lossif a Status 2 herd is not correctlypredicted: Price[3 months in Status 2] -Price[3 months in Status 2]* P(Interventions fail) -Price[Interventions] Lossif a Status 1 herd is not correctlypredicted: Price[Interventions] Detecting Dairy Herds
Suggestedestimation of αbasedonsocietalcosts ReplacePrice[3 months in Status 2] by R0[Price[3 months in Status 2] +cost(human infections) per herd] where R0 denotes the average excess number of infected herds due to delayed identification. Higherα and lowerthresholdr. Thesecostvaluesare not known and dependent onlegislation Detecting Dairy Herds
Geographical distribution of risk herds (α=5)3rdquarter 2007. Detecting Dairy Herds
Conclusion Wesuggestthatrisk herds maybedefined as herds with a risk score over a thresholdr, with r taking a value from -1.05 and lower, dependingon the nature of sanctions and the importance of detecting status changes. Potential usesifriskindex: replacement of the currentclassification system; potential legal conflictsshouldbeclarified. Alternatively, a mandatorynotice to the farmer on a risk herd classification, allowingvoluntary interventions; Cominglegislationshouldencourage farmers to intervene. However, cost to society is higherthan the cost to individual farmers due to spread of disease, so a higherαvalue and thuslowerthreshold r couldapply. Detecting Dairy Herds
Acknowledgement We thank Jørgen Nielsen from the Danish Cattle Federation for providing register data from the Danish Cattle Database. Thanks Jørgen. Detecting Dairy Herds