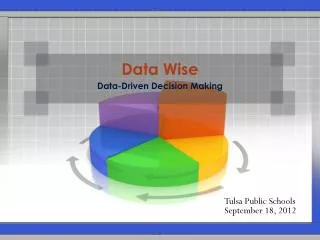
Data-Driven Decision Making: Essential Conditions for Success
350 likes | 496 Vues
Data-driven decision making is critical for effective educational reform, particularly under the NCLB mandate. It advocates the integration of data into teaching and administration, allowing for informed decisions that benefit students, teachers, and the community. By establishing clear standards, setting measurable goals, and utilizing advanced assessment methods, schools can continuously improve their instructional strategies. Effective training for educators in data use and technology is essential, as is fostering a culture of accountability. This new paradigm creates personalized learning experiences, ensuring the success of every student.

Data-Driven Decision Making: Essential Conditions for Success
E N D
Presentation Transcript
Data-Driven Decision Making:Essential Conditions for Success
Context • Standards driven reform • Assessments tied to standards • Raised expectations for all students • Technology tools • Accountability mandates in NCLB Act
Moving Beyond the Mandate NCLB is an opportunity to: • Use data to transform teaching, learning and administration. • Inform decisions about everything from class schedules to textbook reading levels to professional development budgets. • Provide a rationale for decisions that parents, teachers, taxpayers, and students can understand.
What the NCLB Comprehensive Reform Will Do • Provide professional development and training • Disseminate and provide information, reports, publications • Develop teacher and school leader in-service and pre-service training modes that illustrate best practices
Data Driven Decision Making • Data Driven Decision Making provides a structure - a set of guidelines for knowing what decisions to make. • Effective technology training for teachers results in the capacity to share data leading to a deeper understanding of both teacher learning and student success.
The Foundation of Data-Driven Instructional Decisions • Assess and examine data first • Emphasize what is important • Set goals that can be assessed • Focus on what is effective • Align goals with instructional strategies
A New Paradigm Shift Sophisticated data collection + Dissemination technologies + Better understanding of how individuals learn + New assessments =Transformation of Education
Applications SIS Assessment Finance Instruction Components of a Data Based Decision Making System Reporting and Analysis ServicesTurning data into useful information Dissemination Sharing data with the community (ie: report cards) Data Warehouse Reports State and Federal Reporting Meeting reporting compliance Training Learning how to use data to make informed decisions. Personalized Instruction Source: US Department of Education, 2003.
Data Rich Districts School districts and school district consortia are moving a step ahead of NCLB requirements by integrating data reporting into a culture of continuous improvement.
Rapid Results The three concepts that are the foundation for school improvement: are informed, • effective teamwork; • goals setting; and • the use of performance data. Schaffer 1988
School Improvement Process • Set measurable goals and targets • Collect data using electronic methods • Deliver information to decision makers (classroom, building, district) • Clearly Identify levels of performance measures and opportunities for improvement
Data Collection: An Iterative Process Standards Instruction Vision Assessments Reports
The Power of Data • Assesscurrent and future needs of students • Decidewhat to change • Determineif goals are being met • Engagein continuous school improvement • Identifyroot causes of problems • Promoteaccountability
Early Screening Works • Identifies students who are likely to have problems learning • Administers easily and quickly • Facilitatesselective use of diagnostic assessments • Providesaccurate and reliable data
Screening and Diagnostic Assessments • DIBELS-- Dynamic Indicators of Basic Early Literacy Skills • TPRI-- Texas Primary Reading Inventory • Tejas LEE -- Reading Inventory in Spanish
Technology Solution • Eliminates paperwork, stopwatches and manual calculations – and gives instant results Streamlined assessing Improved accuracy • Automates scoring, timing and prompting requirements - teacher can focus on student, NOT test Ability to analyze, act on data • With the push of a button, teachers can access Web-based reports that help them turn results into action
Intensive SupportMonitoring recommended two to four times a month. Students should receive intensive remediation and differentiated instruction. Strategic SupportMonitoring recommended once a month. Students should receive strategic interventions and differentiated instruction. Benchmark SupportAdditional monitoring not required. Students are achieving on grade level at appropriate developmental stage.
Ready or Not . . .The World is Different • Work is different ... • Tools are different ... • Communication is different ... • Information is different ... • Kids are different ... • Learning is different … • Teaching must be different ... And Leading must be different!
Research shows… “…leadership ... the single most important factor affecting the successful integration of technology into schools. This is true at all levels- state, district, and schools.” Lessons Learned SEIR*TEC (2002)
What we know about effective use of technology in schools • The world is different • New environments enable more effective strategies • Essential conditions are essential • Highly skilled teachers and administrators are required • Assessment is critical
eLearning Principals Technology Leadership Institute • Integrating Technology into the Teaching and Learning Process • Principals’ Productivity and Professional Practice • Technology Tools for Support, Management, and Operations • Assessment and Evaluation with Technology
Research Shows “Students whose teachers were high level users of technology in the classroom scored significantly better than did students whose teachers were low level users of technology in the classroom.” Middleton and Murray, 1999
Technology and Work • 340K unfilled jobs requiring tech skills • 60% of current jobs require tech skills • 70% growth in computer and tech jobs • Accessing jobs often requires tech skills
Increase Technology Literacy of 8th Grade Students • Partnered with Learning Point Associates to assess student technology literacy knowledge, attitudes, and practices based on National Educational Standards for Students (NETS•S) • An 8th grade educational technology curriculum sequence aligned to Texas Learning Standards for language arts, mathematics, and science as well as measurable technology literacy outcomes
NETS•S Assessment & Curriculum • 7th and 8th grade technology literacy assessment • 7th and 8th grade technology literacy curriculum
Standards for Students • Basic operations and concepts • Social, ethical, and human issues • Productivity tools • Communication tools • Research tools • Problem solving and decision making tools • Adopted, adapted, or aligned by 33 states
Technology Professional Development • Focused on student achievement. • Connected to the classroom. • Integrated with the curriculum. • Sustained and collaborative process. • Supports individual learning styles and experiences. • Evaluation is embedded throughout.
Progressive Levels • Using technology to improve teachers’ professional practices . • Using technology tools and information to plan and implement enhanced learning experiences in the core curriculum. • Integrating technology tools and information to build technology literacy and problem solving ability among students.
“Collecting data is only the first step toward wisdom. But sharing data is the first step toward community.” IBM – On Demand Business Prodigy Advertisement
Barriers to Data Use • Lack of training in data use • No uniform data collection • Lack of leadership at the school and district level • Outdated technology • Unclear priorities and goals • Lack of teamwork • Distrust of data use
Lessons Learned • It takes time. • It has to start at the top. • Progress has to be measurable. • Business models are starting points. • Community outreach is essential. • Data driven decision making can be a powerful tool in changing student outcomes and promoting continuous improvement in achievement.
Reasons to Bring Data Into Decisions • Assess the current and future needs of students. • Decide what to change. • Determine if goals are being met. • Engage in continuous school improvement. • Identify root causes of problems. • Align instruction to standards. • Provide personalized instruction. • Track professional development. • Meet accountability provisions of NCLB. • Keep constituents informed about progress.
Making It Happen: Integrating Data Into the Equation To consider: • Implementation scale and scope • What to gather • Cleaning up the data • Reporting out and user queries • Cost of adoption • Professional development • Collaboration and partnerships
What gets measured gets done. Peters 1987