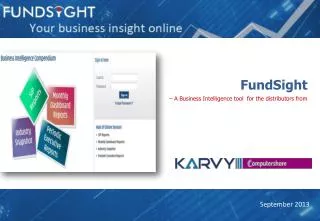
Enhancing Distributor Access to Comprehensive Performance Data with FundSight
FundSight is a cutting-edge Business Intelligence (BI) platform designed to empower mutual fund distributors with instant access to extensive performance data. Traditionally, distributors faced limitations accessing important metrics like inflows, outflows, and AUM strictly within their local markets. FundSight offers a user-friendly interface that allows for benchmarking against industry performance over various parameters. Its advanced reporting tools enable detailed analysis, comparison over similar time periods, and customized reports. With its anytime, anywhere accessibility and innovative graphical representations, FundSight significantly enhances distributors' capability to drive growth in the mutual fund industry.

Enhancing Distributor Access to Comprehensive Performance Data with FundSight
E N D
Presentation Transcript
The need • Traditionally distributors have been accessing performance data with regard to inflows, outflows, netflows, AUM etc. only within their own geographical boundaries • There was a need to support them with a platform that allows them to benchmark their performance vis-a-vis the industry performance in all the parameters mentioned above, and more • Keeping the above facts in view, it is necessary that all distributors have equal access to: • Complete industry performance data • Statistical highlights of a period • ‘You’ vs. ‘All’ distributors performance data • Comparison over similar time periods • Comparisons with various parameters / combination of parameters • With its user friendly, anytime anywhere accessibility, and convenience of report generation, this platform provides superior information to the distributors. A well informed distributor can help spur the growth of the Mutual Fund Industry
Introduction • FundSight is a comprehensive Business Intelligence (BI) tool, focused on providing Multi-dimensional composite view to distributors with their peers • FundSight has been developed as a user friendly web-interface to cull out important business information that can be used for various analysis and peer level comparisons • Multiple reporting filters: • Investor • Asset class • Geography • Time • Convenient parameterization of metrics: • AUM or Average AUM (AAUM) • Inflows/ outflows/ net-flows • Live investors (folios) • No of transactions • Special products (Fresh registrations/ cancellations/ terminations/ avg. ticket size & tenure) • Type of transaction • Easy reporting styles • Pre defined reports • Drill-down reports • Custom Build reports • Usage Reports
Reporting capabilities – Graphical representation Select your desired Asset class for graphical representation of all the dimensions based on the same Roll-over mouse on the Histograms to view further details Different colors differentiating ‘YOU’ with Rest of the Industry • View performance by way of graphical representation. The most convenient way to view and analyze reports • Graphical representation limited to your desired dimension • Convenient color combinations to differentiate “YOU” with “OTHERS” • Roll-over mouse pointer on the histograms for relevant numbers • Choose the desired asset class, graphical dashboards will change accordingly
Reporting capabilities – Drill down reports Choose next report dimension of your choice and click here for drill-down to next level You are at this level of Drill-down Want to save results? Export to excel • Select a specific month / period for report generation • Separate reports available for both, SIP and regular transactions • An on-screen display of data based on report parameters and allows you to drill-down to next level of report dimension of your choice • Sort the relevant numbers based on your ‘needs’ • Export the report outcome in excel at any stage, for future reference.
Reporting capabilities – Drill down reports Select the period for report generation Click on the report dimension to drill-down to the next pre-defined level Click for further drill down • An on-screen display of data with a drill-down facility to the next level of pre-defined report dimension. • Displays the complete trail of drill-down • Export into excel with complete trail of drill-down
Reporting capabilities – Custom build reports Choose report dimensions and conditions Choose zone Choose the report parameters • A Query builder that allows you to choose you own dimensions, parameters and period for report generation • Display field names as per your convenience using ‘Alias’ • Report output exportable to excel
Key Advantages to Distributors • Internet based application: • Access anytime / anywhere • Ease of data availability • No compromise on security • Graphical representation: • Highly convenient way to read the data • Clear demarcation and display of ‘You’ vs. ‘Others’ • Graphical representation as per asset class selection • Drill down reports: • Self defined drill-down parameters • Exportable to ‘Excel’ at any level of drill-down • Custom build reports: • Generate report as per desired parameters • Download the data for further analysis • Other report: • Custom Build Reports • SIP related reports • Other critical MI