Download
1 / 40
420 likes | 546 Vues
Empirical Methods to Evaluate the Instructional Sensitivity of Accountability Tests. Stephen C. Court Presented at Association of Educational Assessment - Europe 10th Annual Conference Innovation in Assessment to meet changing needs 5 - 7 November 2009 Valletta, Malta.

E N D
Empirical Methods to Evaluate the Instructional Sensitivityof Accountability Tests Stephen C. Court Presented at Association of Educational Assessment - Europe 10th Annual Conference Innovation in Assessment to meet changing needs 5 - 7 November 2009 Valletta, Malta
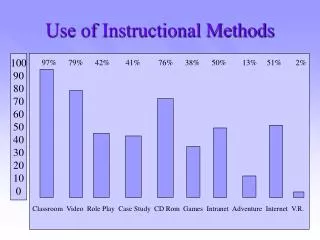
Basic Assumption of Accountability Systems Student test scores accurately reflect instructional quality Higher scores = greater learning due to higher quality teaching Lower scores = less learning due to lower quality teaching In short, it is assumed, accountability tests are instructionally sensitive.
Reality The assumption rarely holds. Most accountability tests are not sensitive to instruction because they simply were not constructed to be instructionally sensitive. The tests are built to the same general “Army Alpha” specifications - originally designed during the First World War – used to differentiate between officer candidates and enlisted personnel.
In principle: Lack of fairness Lack of trustworthy evidence to support validity arguments In practice Bad policy Bad evaluation Bad things happen in the classroom Consequences of Instructional Insensitivity
SES disparities between districts The situation in Kansas - SES
Disparities in state assessment scores and proficiency rates The situation in Kansas- Test Scores
The Situation in Kansas Can the instruction in high-poverty districts be so much worser than the instruction in low-poverty districts? Or, are construct-irrelevant factors (such as SES) masking the effects of instruction?
The basic question: What methods can be employed to evaluate the instructional sensitivity of accountability tests?
DefinitionInstructional Sensitivity “the degree to which students’ performances on a test… accurately reflect the quality of instruction provided specifically to promote students’ mastery of the knowledge and skills being assessed.” (Popham, 2008)
Two-pronged Approach At last year’s AEA conference in Hissar, Popham (2008) advocated a two-pronged approach to evaluating instructional sensitivity: • Judgmental strategies • Empirical studies
Empirical Study Following the guidance of Popham (2007)… three Kansas school districts conducted an empirical study of the Kansas assessments.
Description of the Kansas Study Teachers were invited to complete a brief online rating form. Participation was voluntary. Each teacher identified the 3-4 indicators (curricular aims) he or she had taught best during the 2008-2009 school year. Student results were matched to responding teachers.
Study Participants 575 teachers responded • 320 teachers (grades 3-5 reading and math) • 129 reading teachers (grades 6-8) • 126 math teachers (grades 6-8) 14,000 students
A Gold Standard Typically, test scores are used to confirm teacher perceptions…as if the test scores are infallible and the teachers are always suspect. In fact, for the first 40 years of inquiry into instructional sensitivity, teacher perceptions were never even part of the mix. Instructional sensitivity studies always contrasted two sets of scores – e.g. pre-test/post-test, not-taught/taught, etc. Asking teachers to identify their best-taught indicators has changed the instructional sensitivity issue both conceptually and operationally.
A = Non-Learning B = Learning C = Slip D = Maintain A = True Fail B = False Pass C = False Fail D = True Pass Old and New ModelInstructional Sensitivity
Kansas StudyPropensity Score Matching Propensity scores were generated from logistic regression: Several demographic and prior performance characteristics were regressed on overall proficiency rate. Probabilities were used to match “Not-Best-Taught” with “Best-Taught” students using “nearest neighbor” method. Purpose: to form quasi- “random equivalent groups” of similar size for each content area, grade level, and indicator configuration.
Basic Contrast The basic contrast involved “best-taught” versus “not-best-taught” For example… Grade 3 Reading – Indicator 1… Given average class size, 160 teachers responded 30 teachers identified Indicator 1 as one of their best-taught. From among the pool of other teachers and their students, the propensity score matching was used to form an equivalent group of 750 students from 30teachers.
Initial Analysis Scheme Conduct independent t-tests with • mean indicator score as dependent variable • Best-taught versus Other students as independent variable
Initial Analysis Scheme Initial logic: If best-taught students outperform other students, indicator is sensitive to instruction. If mean differences are small or in the wrong direction, indicator is insensitive to instruction.
Problem But significant performance differences between best-taught and other students do not necessarily represent significant differences in instructional sensitivity. Instead, instructional sensitivity is about whether the indicator accurately distinguishes effective from ineffective instruction – without confounding from any form of construct irrelevant easiness or difficulty.
Basic Concept In its simplest form, Popham’s definition of instructional sensitivity can be depicted as a 2x2 contingency table.
Mean Least effective = B/(A+B) Mean Most effective = D/(C+D) But Mean Least effective = False Pass/(True Fail + False Pass) makes no sense at all. In fact, it returns to the outcome as infallible and the teacher perceptions as suspect: If the pass-rate for the two groups are statistically similar, then the degree of difference between less and most effective must be questioned. Basic Concepts
Rather than comparing means, we instead need to look at the combined proportions of true fail and true pass. That is, (A + D) / (A + B + C + D) Which can be shortened to (A + D) / N Conceptually Correct
Index 1 (A + D) / N Ranges from 0 to 1 (Completely Insensitive to Totally Sensitive) In practice: Values < .50 are worse than random guessing
(A + D)/N = (50 + 50)/100 = 1.0 A totally sensitive test would cluster students into A or D. Totally Sensitive
(A+D)/N = (0+0)/100 = 0.0 A totally insensitive test clusters students into B and C Totally Insensitive
(A+D)/N = (25+25)/100 = 0.50 0.50 = mere chance Values < 0.50 are worse than chance. Useless
Index 1 Equivalents Index 1 is conceptually equivalent to: • Mann-Whitney U • Wilcoxon statistic • Transposing Cell A and Cell B, then running a t-test • Area Under the Curve (AUC) in Receiver Operating Characteristic (ROC) curve analysis
ROC Curve Analysis Has rarely been used in domain of educational research More commonly used in • medicine and radiology • data mining (information retrieval) • artificial intelligence (machine learning) The use of ROC curves was first introduced during WWII in response to the challenge of how to accurately identify enemy planes on radar screens.
AUC Context ROC Curve Analysis – especially the AUC - is more useful for several reasons: • Easily computed • Easily interpreted • Decomposable into sensitivity and specificity • Sensitivity = D / (B+D) • Specificity = C / (A+C) • Easily graphed as (Sensitivity) versus (1 – Specificity) • Readily expandable to polytomous situations • Multiple test items in a subscale • Multiple subscales in a test • Multiple groups being tested
Basic Interpretation(Descriptive) Easy to compute: (A+D)/N Easy to interpret… • .90-1.0 = excellent (A) • .80-.90 = good (B) • .70-.80 = fair (C) • .60-.70 = poor (D) • .50-.60 = fail (F) Less than .50 is worse than guessing!
Basic Interpretation Most statistical software packages – e.g., SAS, SPSS - include a ROC procedure. The area under the curve table displays • estimates of the area, • standard error of the area, • confidence limits for the area, • and the p-value of a hypothesis test.
ROC Hypothesis Test The null hypothesis: true AUC = .50. So, use of ROC Curve Analysis in this context would support rigorous psychometric inquiry into instructional sensitivity. Yet, the A, B, C, D, F system could be reported in ways that even the least experienced reporters or policy-makers can readily understand.
Curve 1 = .50 Pure chance…no better than random guess Curve 4 = 1.0 Totally Sensitive completely accurate discrimination between effective and less-effective instruction Curve 3 is better than Curve 2 Area Under Curve (AUC) - Graphed
ROC Curve Interpretation Greater AUC values indicate greater separation between distributions e.g., Most effective versus less effective Best taught versus Not-best-taught 1.0 = complete separation – that is, total sensitivity
ROC Curve Interpretation AUC values close to .50 indicate no separation between distributions. AUC = .50 indicates • complete overlap • No difference • might as well guess
Procedural Review Step 1: Cross-tabulate not/pass status with teacher identification of best-taught indicators Step 2: (Optional) Use logistic regression and propensity score matching to create randomly-equivalent groups – or, as close as you can get Step 3: Use (A+D)/N or formal ROC Curve Analysis to evaluate instructional sensitivity at the smallest grain-size possible – preferably, at the wrong/right level of individual items.
In Closing The assumption that accountability tests are sensitive to instruction rarely holds. Inferences drawn from test scores about school quality and teaching effectiveness must be validated before action is taken. The empirical approaches presented here should prove helpful in determining if the inference that a test is instructionally sensitive is indeed warranted.
Presenter’s email address:scourt@usd259.net Questions, comments, or suggestions are welcome