Download
1 / 20
200 likes | 277 Vues
This project focuses on affordable, community-involved housing conservation through low-cost improvements, retrofitting, and alternative energy solutions. It aims to educate, implement energy-efficient components, and provide everyday savings for households.

E N D
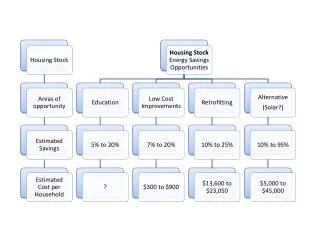
Housing StockInvest in Conservation First Actions • Educate • Address Low Cost Improvements • Address Envelope & Energy Efficient Components (retrofit) • Alternatives (solar?) implementation (Solar, for example, will cost less if a smaller system is required as a result of actions 1, 2 and 3)
Education: Est. Savings 5% to 20% Est. Cost: TBD • Affordable • Community Involvement • Limitless • Bold • Access to Schools • Everyone can suggest new ideas • Everyday savings
Low Cost Improvements: Est. Savings 7% to 20% - Est. Cost $300 to $900 per household • Facts: • 90% homes built before 2000 • Newer homes are also part of the equation • 51% owner occupied • 49% household income less than $35,000 • Affordable • Everyday Savings • Weapons • Minimum energy standards prior to RE listing • Rebates & Incentives • Low income program
Average Home? • 1700 SF • 3 Bed • 2 Bath • Year built?
Cost of Low Cost Improvements • 2 Low Flow showerheads • 3 sink aerators • 40 cfls • Water heater timer (if electric wh) • Water heater blanket • 2 door weather-strip • Attic hatch insulation • Caulk windows • Outlet and switch gaskets • Programmable thermostat Cost: $300 to $900 Estimated Savings: 7% to 17%
Average Savings 24.25%
Retrofitting: Est. Savings 10% to 25% Est. Cost $13,600 to $23,050 per household • Facts: • 89% homes built before 2000 • 62.4% single units (53.2% Single family, 9.2% Mobile Homes) • 63% household income less than $50,000 • 49% renter occupied • High Cost • Landlords do not invest because there is not benefit for them • Not affordable for a high percent of homeowners • Long payback • Mainly seasonal savings • People address if a damage occurs and generally choose by cost • Weapons • Rebates & Incentives • Low income program • Regulation (for landlords) • Loans for Retrofitting
Costs for retrofit average home • HVAC Seer 16 or better: $5,000 - $9,000 • Double pane windows: $4,000 - $7,000 • Water Heater: $600 - $850 • Attic Insulation to R-30: $600 - $1,000 • Radiant barrier: $1,200 - $1,800 • ES Refrigerator: $600 - $1,200 • ES Washer: $600 - $800 • ES Dryer: $600 - $800 • ES Dishwasher: $400 - $600 • Duct Sealing: $300 - $1,000 Estimated Total Cost: $13,600 - $23,050 Estimated Savings: 10% to 25%?
Alternative (Solar?): Est. Savings 10% to 95% Est. Cost $5,000 to $45,000 per home • Facts: • 89% homes built before 2000 • 62.4% single units (53.2% Single family, 9.2% Mobile Homes) • 63% household income less than $50,000 • 49% renter occupied • High Cost • Landlords refuse to invest because there is not benefit for them • Not affordable for a high percentage of homeowners • Long payback • System will cost less if Conservation and efficiency were addressed before • Weapons • Rebates & Incentives • Regulation • Financing
Recommended ActionsResidential Sub-Committee • Gather Information: Consumption, demographics, social, economic, housing, costs, etc. • Determine Indexes (Actual ) KWH/sf/day – KWH/pc/day • Analyze information • Identify opportunities • Design Action Plan • Select Weapons • Set reduction Goals • Execute plan • Follow-up
Follow up • KWH/SF/day: Today (Goal: in one year/two/five/ten) • KWH/per capita/day (Goal: in one year/two/five/ten) • Agreement with google, zillow-like platforms to make this info available to the public
1. Information Gathering • Megawatts Total Residential Consumption year • KWH/SF/Day (For every month) • KWH/pc/Day (For every month) • Total residential sqft (heated area) • Demographics (age, households by type) • Social (disability, educational, language) • Economic (income, occupation, education) • Housing (occupancy, units in structure, year structure built, housing tenure) • Average home characteristics • Estimated costs (retrofitting, Low Cost Improvements, Certification/inspection)
GRU’s - Gainesville Residential Average Consumption 798 KWh per 1,000 sq. feet per month = 0.798 KWh per sq. feet per month = 0.0266 KWh per sq. feet per day It is important to have this index for every single month. Source GRU Customer Bulletin – August 2007
(2005 census data)Alachua County Population= 210,323 Age: Less than 10 24,375 11.6% 10 to 19 26,095 12.4% 20 to 34 66,495 31.6% 35 to 54 51,712 24.6% 55 and older 41,646 19.8%
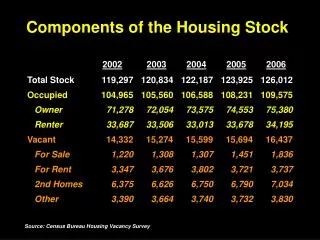
(2005 census data)Housing Stock Total UNITS= 104,613 Year Structure: Built Before 2000: 92,884 89% Type of structure: Single 55,622 53.2% Mobile Home 9,672 9.2% Two units 3,483 3.3% Three to nine units 18,286 17.5% 10 or more 17,550 16.8% Occupied units: 94,960 90.77%
(2005 census data)Housing Stock: Occupied UNITS= 94,960 Housing Tenure: Renters 46,913 49% Owners 48,047 51% Occupancy: family owners 32,672 34.4% non family owners 15,375 16.1% family renters 15,528 16.4% non family renters 31,385 33.1%
(2005 census data)Housing Stock: Households= 94,960 Income: Less than $35,000 46,934 49% $35,000 to $49,999 13,298 14% $50,000 to $74,999 14,739 16% $75,000 and Up 19,989 21% Type of Households: Family with own children under 18 21,092 22.2% Married couple with NO children under18 20,557 21.6% Non Family living alone under 65 24,129 25.4% Non Family living alone 65 and over 6,492 6.9% Other 22,690 23.9%