Sensitivity, Specificity and ROC Curve Analysis
290 likes | 673 Vues
Sensitivity, Specificity and ROC Curve Analysis. Criteria for Evaluating a Screening Test. Validity : provide a good indication of who does and does not have disease -Sensitivity of the test -Specificity of the test

Sensitivity, Specificity and ROC Curve Analysis
E N D
Presentation Transcript
Criteria for Evaluating a Screening Test • Validity: provide a good indication of who does and does not have disease • -Sensitivity of the test • -Specificity of the test • Reliability: (precision): gives consistent results when given to same person under the same conditions • Yield: Amount of disease detected in the population, relative to theeffort • -Prevalence of disease/predictive value
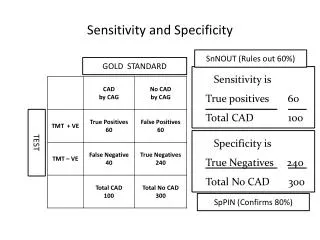
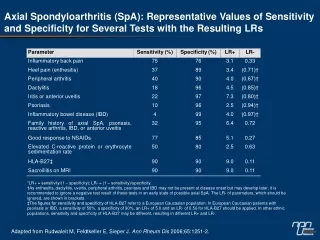
Validity of Screening Test (Accuracy) • - Sensitivity: Is the test detecting true cases of disease? Ideal is 100%: 100% of cases are detected; =Pr(T+|D+) • -Specificity: Is the test excluding those without disease? Ideal is 100%: 100% of non-cases are negative; =Pr(T-|D-) • - See Gehlbach, Chp. 10
Example: Screening for Glaucoma using IOP True Cases of Glaucoma Yes No IOP > 22: Yes 50 100 No 50 1900 (total) 100 2000 Sensitivity = 50% (50/100) False Negative=50% Specificity = 95% (1900/2000) False Positive=5%
Where do we set the cut-off for a screening test? Consider: -The impact of high number of false positives: anxiety, cost of further testing -Importance of not missing a case: seriousness of disease, likelihood of re-screening
Yield from the Screening Test: Predictive Value • Relationship between Sensitivity, Specificity, and Prevalence of Disease • Prevalence is low, even a highly specific test will give large numbers of False Positives • Predictive Value of a Positive Test (PPV): Likelihood that a person with a positive test has the disease • Predictive Value of a Negative Test (NPV): Likelihood that a person with a negative test does not have the disease
Screening for Glaucoma using IOP True Cases of Glaucoma Yes No IOP > 22: Yes 50100 No 501900 (total) 100 2000 Specificity = 95% (1900/2000) False Positive=5% Positive Predictive Value =33% (50/150)
How Good does a Screening Test have to be? IT DEPENDS -Seriousness of disease, consequences of high false positivity rate: -Rapid HIV test should have >90% sensitivity, 99.9% specificity -Screen for nearsighted children proposes 80% sensitivity, >95% specificity -Pre-natal genetic questionnaire could be 99% sensitive, 80% specific
Choosing a cut-point: receiver operating characteristic curves • Situation where screening test yields results as a continuous value (e.g., intraocular pressure for glaucoma) • Want to select a value above (or below) which to call “diseased” or “at risk” • How do we select that value?
Non-diseased cases Diseased cases Threshold Test result value or subjective judgment of likelihood that case is diseased
More typically: Non-diseased cases Diseased cases Test result value or subjective judgment of likelihood that case is diseased
Non-diseased cases TP Fraction (sensitivity) Threshold less aggressive mindset Diseased cases FP Fraction (1-specificity)
Non-diseased cases moderate mindset TP Fraction (sensitivity) Threshold Diseased cases FP Fraction (1-specificity)
Non-diseased cases more aggressive mindset TP Fraction (sensitivity) Threshold Diseased cases FP Fraction (1-specificity)
Threshold Non-diseased cases Entire ROC curve TP Fraction (sensitivity) Diseased cases FP Fraction (1-specificity)
Entire ROC curve Highly discriminate (good) chance line TP Fraction (sensitivity) Reader Skill and/or Level of Technology Somewhat discriminate (not as good) FP Fraction (1-specificity) Use area under to curve (AUC) to judge discriminating ability. Gehlbach: want AUC>80% Non-informative (no better than chance)
Luke Neff: Refractory Burn Shock DataLogistic Regression and ROC Curve Analysis
Luke Neff: Refractory Burn Shock DataLogistic Regression and ROC Curve Analysis
Luke Neff: Refractory Burn Shock DataLogistic Regression and ROC Curve Analysis
Point that Maximizes sum of sensitivity and specificity. Corresponds to lactate value of about 3.0