Outlier Detection & Analysis
Outlier Detection & Analysis. By: Eric Poulin Colin Yu. Outlier - Outline. Introduction / Motivation / Definition Statistical-based Detection Distribution-based, depth-based Deviation-based Method Sequential exception, OLAP data cube Distance-based Detection


Outlier Detection & Analysis
E N D
Presentation Transcript
Outlier Detection & Analysis By: Eric Poulin Colin Yu
Outlier - Outline • Introduction / Motivation / Definition • Statistical-based Detection • Distribution-based, depth-based • Deviation-based Method • Sequential exception, OLAP data cube • Distance-based Detection • Index-based, nested-loop, cell-based, local-outliers • Questions
Introduction • Traditional Data Mining Categories • Majority of Objects • Dependency detection • Class identification • Class description • Exceptions • Exception/outlier detection
Motivation for Outlier Analysis • Fraud Detection (Credit card, telecommunications, criminal activity in e-Commerce) • Customized Marketing (high/low income buying habits) • Medical Treatments (unusual responses to various drugs) • Analysis of performance statistics (professional athletes) • Weather Prediction • Financial Applications (loan approval, stock tracking) “One persons noise could be another person’s signal.”
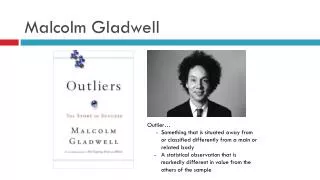
What is an outlier? • Observations inconsistent with rest of the dataset – Global Outlier • Special outliers – Local Outlier • Observations inconsistent with their neighborhoods • A local instability or discontinuity
Causes of Outliers • Poor data quality / contamination • Low quality measurements, malfunctioning equipment, manual error • Correct but exceptional data
Outlier Detection Approaches • Objective: • Define what data can be considered as inconsistent in a given data set • Statistical-Based Outlier Detection • Deviation-Based Outlier Detection • Distance-Based Outlier Detection • Find an efficient method to mine the outliers
Why A Special Technique to Identify Outliers? • Why not just modify clustering or other algorithms to detect outliers? • Performance considerations • Subjective to the clustering algorithm and clustering parameters • Only certain attributes may have outlier properties, no need to disqualify the entire tuple • Contamination may occur by “column”, not by row
Outlier Analysis - Outline • Introduction / Motivation / Definition • Statistical-based Detection • Distribution-based, depth-based • Deviation-based Method • Sequential exception, OLAP data cube • Distance-based Detection • Index-based, nested-loop, cell-based, local-outliers • Questions
Statistical-Based Outlier Detection (Distribution-based) • Assumptions: • Knowledge of data (distribution, mean, variance) • Statistical discordancy test • Data is assumed to be part of a working hypothesis (working hypothesis) • Each data object in the dataset is compared to the working hypothesis and is either accepted in the working hypothesis or rejected as discordant into an alternative hypothesis (outliers)
Statistical-Based Outlier Detection (Distribution-based) • Assumptions: • Knowledge of data (distribution, mean, variance) • Statistical discordancy test • Data is assumed to be part of a working hypothesis (working hypothesis) • Each data object in the dataset is compared to the working hypothesis and is either accepted in the working hypothesis or rejected as discordant into an alternative hypothesis (outliers)
Statistical-Based Outlier detection (Depth-based) • Data is organized into layers according to some definition of depth • Shallow layers are more likely to contain outliers than deep layers • Can efficiently handle computation for k < 4
Statistical-Based Outlier Detection • Strengths • Most outlier research has been done in this area, many data distributions are known • Weakness • Almost all of the statistical models are univariate (only handle one attribute) and those that are multivariate only efficiently handle k<4 • All models assume the distribution is known –this is not always the case • Outlier detection is completely subjective to the distribution used
Outlier Analysis - Outline • Introduction / Motivation / Definition • Statistical-based Detection • Distribution-based, depth-based • Deviation-based Method • Sequential exception, OLAP data cube • Distance-based Detection • Index-based, nested-loop, cell-based, local-outliers • Questions
Deviation-Based Outlier Detection • Simulate a mechanism familiar to human being: after seeing a series of similar data, an element disturbing the series is considered an exception • Sequential Exception Techniques • OLAP Data Cube Techniques
Sequential Exception • Select subsets of data Ij (j=1,2,…,n) from the dataset I • Compare the dissimilarity of I and (I-Ij) • Find out the minimum subset Ij that reduce the disimuliarity the most • Smoothing factor • D is a dissimilarity function • C is a cardinality function, for example, the number of elements in the dataset
Example Let the data set I be the set of integer values {1,4,4,4} Note, when Ij = {}, D(I) = D(I-Ij) = 1.69, SF(Ij)=0 When Ij={1}, SF(Ij) has the maximum value, so {1} is the outlier set
OLAP Data Cube Technique • Deviation detection process is overlapped with cube computation • Precomputed measures indicating data exceptions are needed • A cell value is considered an exception if it is significantly different from the expected value, based on a statistical model • Use visual cues such as background color to reflect the degree of exception
Outlier Analysis - Outline • Introduction / Motivation / Definition • Statistical-based Detection • Distribution-based, depth-based • Deviation-based Method • Sequential exception, OLAP data cube • Distance-based Detection • Index-based, nested-loop, cell-based, local-outliers • Questions
Distance-Based Outlier Detection • Distance-based: An object O in a dataset T is a DB(p,D) outier if at least fraction p of the objects in T are >= distance D from O • A point O in a dataset is an outlier with respect to parameters k and d if no more than k points in the dataset are at a distance of d or less from O. • Relative measurement: Let Dk(O) denote the distance of the kth nearest neighbor of O. It is a measure of how much of an outlier point O is.
Index-based Algorithm [KN98] • Indexing Structures such as R-tree (R+-tree), K-D (K-D-B) tree are built for the multi-dimensional database • The index is used to search for neighbors of each object O within radius D around that object. • Once K (K = N(1-p)) neighbors of object O are found, O is not an outlier. • Worst-case computation complexity is O(K*n2), K is the dimensionality and n is the number of objects in the dataset. • Pros: scale well with K • Cons: the index construction process may cost much time
Nested-loop Algorithm [KN98] • Divides the buffer space into two halves (first and second arrays) • Break data into blocks and then feed two blocks into the arrays. • Directly computes the distance between each pair of objects, inside the array or between arrays • Decide the outlier. • Here comes an example:… • Same computational complexity as the index-based algorithm • Pros: Avoid index structure construction • Try to minimize the I/Os
Example – stage 1 Buffer DB A is the target block on stage 1 Load A into the first array (1R) Load B into the second array (1R) Load C into the second array (1R) Load D into the second array (1R) Total: 4 Reads Starting Point of Stage 1 End Point of Stage 1
Example – stage 2 Example Buffer DB D is the target block on stage 2 D is already in the buffer (no R) A is already in the buffer (no R) Load B into the first array (1R) Load C into the first array (1R) Total: 2 Reads Starting Point of Stage 2 End Point of Stage 2
Example – stage 3 Buffer DB C is the target block on stage 3 C is already in the buffer (no R) D is already in the buffer (no R) Load A into the second array (1R) Load B into the second array (1R) Total: 2 Reads Starting Point of Stage 3 End Point of Stage 3
Example – stage 4 Example Buffer DB B is the target block on stage 4 B is already in the buffer (no R) C is already in the buffer (no R) Load A into the first array (1R) Load D into the first array (1R) Total: 2 Reads Every block is ¼ of the DB. From stage 1-4, a grand total of 10 blocks are read, amounting to 10/4 passes over the entire dataset. Starting Point of Stage 4 End Point of Stage 4
Cell-Based Algorithm [KN98] • Divide the dataset into cells with length • K is the dimensionality, D is the distance • Define Layer-1 neighbors – all the intermediate neighbor cells. The maximum distance between a cell and its neighbor cells is D • Define Layer-2 neighbors – the cells within 3 cell of a certain cell. The minimum distance between a cell and the cells outside of Layer-2 neighbors is D • Criteria • Search a cell internally. If there are M objects inside, all the objects in this cell are not outlier • Search its layer-1 neighbors. If there are M objects inside a cell and its layer-1 neighbors, all the objects in this cell are not outlier • Search its layer-2 neighbors. If there are less than M objects inside a cell, its layer-1 neighbor cells, and its layer-2 neighbor cells, all the objects in this cell are outlier • Otherwise, the objects in this cell could be outlier, and then need to calculate the distance between the objects in this cell and the objects in the cells in the layer-2 neighbor cells to see whether the total points within D distance is more than M or not. • An example
Example Red – A certain cell Yellow – Layer-1 Neighbor Cells Blue – Layer-2 Neighbor Cells Notes: The maximum distance between a point in the red cell and a point In its layer-1 neighbor cells is D The minimum distance between A point in the red cell and a point outside its layer-2 neighbor cells is D
Distance-Based Outlier Detection (Local Outliers) • Some outliers can be defined as global outliers, some can be defined as local outliers to a given cluster • O2 would not normally be considered an outlier with regular distance-based outlier detection, since it looks at the global picture
Distance-Based Outlier Detection (Local Outliers) • Each data object is assigned a local outlier factor (LOF) • Objects which are closer to dense clusters receive a higher LOF • LOF varies according to the parameter MinPts
Distance-Based Outlier Detection (Partition-based) • Partition-based detection • Use BIRCH clustering to identify clusters/partitions of non-outliers • Prune partitions that do not contain outliers • Use Index/Nested Loop algorithms on the remaining data points • Since many data point are removed during pruning, the efficiency is increased significantly.
Outlier Analysis - Outline • Introduction / Motivation / Definition • Statistical-based Detection • Distribution-based, depth-based • Deviation-based Method • Sequential exception, OLAP data cube • Distance-based Detection • Index-based, nested-loop, cell-based, local-outliers • Questions