Basic Principles of Weather Radar
850 likes | 1.11k Vues
Basic Principles of Weather Radar. Dr. Scott M. Rochette. Basis of Presentation. Introduction to Radar Basic Operating Principles Reflectivity Products Doppler Principles Velocity Products Non-Meteorological Targets Summary. Laughlin AFB, TX (KDFX) 0612 UTC 26 May 2001.

Basic Principles of Weather Radar
E N D
Presentation Transcript
Basic Principles of Weather Radar Dr. Scott M. Rochette
Basis of Presentation • Introduction to Radar • Basic Operating Principles • Reflectivity Products • Doppler Principles • Velocity Products • Non-Meteorological Targets • Summary
Laughlin AFB, TX (KDFX) 0612 UTC 26 May 2001 (http://www.weathermatrix.net/radar/education/articles/laughlin/images/KDFX.jpg)
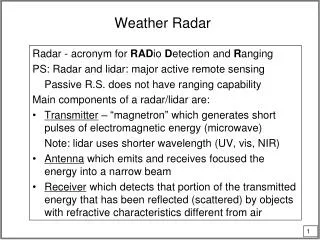
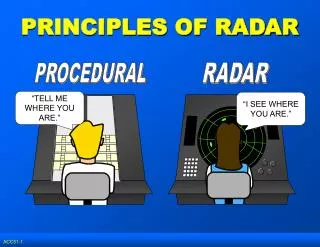
Radar • RAdio Detection And Ranging • Developed during WWII for detecting enemy aircraft • Active remote sensor • Transmits and receives pulses of E-M radiation • Satellite is passive sensor (receives only) • Numerous applications • Detection/analysis of meteorological phenomena • Defense • Law Enforcement • Baseball
Weather Surveillance Radar • Transmits very short pulses of radiation • Pencil beam (narrow cone) expands outward • Pulse duration ~ 1 μs (7 seconds per hour) • High transmitted power (~1 megawatt) • ‘Listens’ for returned energy (‘echoes’) • Listening time ~ 1 ms (59:53 per hour) • Very weak returns (~10-10 watt) • Transmitted energy is scattered by objects on ground and in atmosphere • Precipitation, terrain, buildings, insects, birds, etc. • Fraction of this scattered energy goes back to radar
Determining Target Location • Three pieces of information • Azimuth angle • Elevation angle • Distance to target • From these data radar can determine exact target location
Azimuth Angle • Angle of ‘beam’ with respect to north (University of Illinois WW2010 Project)
Elevation Angle • Angle of ‘beam’ with respect to ground (University of Illinois WW2010 Project)
Distance to Target • D = cT/2 • T pulse’s round trip time (University of Illinois WW2010 Project)
Scanning Strategies 1 • Plan Position Indicator (PPI) • Antenna rotates through 360° sweep at constant elevation angle • Allows detection/intensity determination of precipitation within given radius from radar • Most commonly seen by general public • WSR-88D performs PPI scans over several elevation angles to produce 3D representation of local atmosphere
Plan Position Indicator • Constant elevation angle • Azimuth angle varies (antenna rotates) (University of Illinois WW2010 Project)
Elevation Angle Considerations • Radar usually aimed above horizon • minimizes ground clutter • not perfect • Beam gains altitude as it travels away from radar • Radar cannot ‘see’ directly overhead • ‘cone of silence’ • appears as ring of minimal/non-returns around radar, esp. with widespread precipitation • Sample volume increases as beam travels away from radar
Red numbers are elevation angles • Note how beam (generally) expands with increasing distance from radar (http://weather.noaa.gov/radar/radinfo/radinfo.html)
Blue numbers are heights of beam AGL at given ranges • Most effective range: 124 nm
Scanning Strategies 2 • Range Height Indicator (RHI) • Azimuth angle constant • Elevation angle varies (horizon to near zenith) • Cross-sectional view of structure of specific storm (University of Illinois WW2010 Project)
Radar Equation for Distributed Targets 1 where Pr average returned power A numerical constants B radar characteristics C target scatter efficiency characteristics D equivalent radar reflectivity factor (Ze)
Choice of Wavelength 1 • Typical weather radar range: 0.8-10.0 cm • WSR-88D: ~10 cm • TV radar: ~5 cm
Choice of Wavelength 2 • Pr inversely proportional to square of wavelength (i.e., short wavelength high returned power) • However, shorter wavelength energy subject to greater attenuation (i.e., weaker return signal) • Short wavelength radar better for detecting smaller targets (cloud/drizzle droplets) • Long wavelength radar better for convective precipitation (larger hydrometeors)
Radar Equation for Distributed Targets 2 where Pr average returned power Rc radar constant Ze equivalent radar reflectivity factor (‘reflectivity’) r distance from radar to target
Radar Equation for Distributed Targets 3 • Pr is: • directly proportional to ‘reflectivity’ • inversely proportional to square of distance between radar and target(s)
Equivalent Radar Reflectivity Factor 1 where Ni number of scattering targets Di diameter of scattering targets v pulse volume
Equivalent Radar Reflectivity Factor 2 • Ze relates rainfall intensity to average returned power • ‘Equivalent’ acknowledges presence of numerous scattering targets of varying: • sizes/shapes • compositions (water/ice/mixture) • distributions • Several assumptions made (not all realistic)
Equivalent Radar Reflectivity Factor 3 • Ze is: • directly proportional to number of scatterers • inversely proportional to sample volume • directly proportional to scatterer diameter raised to 6th power • Doubling size yields 64 times the return
dBZ • Typical units used to express reflectivity • Range: • –30 dBZ for fog • +75 dBZ for very large hail
Scanning Modes • Clear-Air Mode • slower antenna rotation • five elevation scans in 10 minutes • sensitive to smaller scatterers (dust, particulates, bugs, etc.) • good for snow detection • Precipitation Mode • faster antenna rotation • 9-14 elevation scans in 5-6 minutes • less sensitive than clear-air mode • good for precipitation detection/intensity determination • trees • Livestock • birds • bats • insects • Other • sun strobes • anomalous propagation
Clear-Air Mode Precipitation Mode
Clear-Air Mode Precipitation Mode Greer, SC (KGSP) (http://virtual.clemson.edu/groups/birdrad/COMMENT.HTM)
Reflectivity Products 1 • Base Reflectivity • single elevation angle scan (5-14 available) • useful for precipitation detection/intensity • Usually select lowest elevation angle for this purpose • high reflectivities heavy rainfall • usually associated with thunderstorms • strong updrafts larger raindrops • large raindrops have higher terminal velocities • rain falls faster out of cloud higher rainfall rates • hail contamination possible > 50 dBZ
Reflectivity Products 2 • Composite Reflectivity • shows highest reflectivity over all elevation scans • good for severe thunderstorms • strong updrafts keep precipitation suspended • drops must grow large enough to overcome updraft
Base Reflectivity Composite Reflectivity Little Rock, AR (KLZK) Precipitation Mode
Z-R Relationships 1 where Z ‘reflectivity’ (mm6 m-3) R rainfall rate (mm h-1) a and b are empirically derived constants
Z-R Relationships 2 • Allow one to estimate rainfall rate from reflectivity • Numerous values for a and b • determined experimentally • dependent on: • Precipitation character (stratiform vs. convective) • Location (geographic, maritime vs. continental, etc.) • Time of year (cold-season vs. warm season)
Z-R Relationships 3 (WSR-88D Operational Support Facility)
Z-R Relationships 4 (WSR-88D Operational Support Facility)
Radar Precipitation Estimation 1 • 1-/3-h Total Precipitation • covers 1- or 3-h period ending at time of image • can help to track storms when viewed as a loop • highlights areas for potential (flash) flooding • interval too short for some applications
Radar Precipitation Estimation 2 • Storm Total Precipitation • cumulative precipitation estimate at time of image • begins when radar switches from clear-air to precipitation mode • ends when radar switches back to clear-air mode • can help to track storms when viewed as a loop • helpful in estimating soil saturation/runoff • post-storm analysis highlights areas of R+/hail • no control over estimation period
1-h Total Precipitation (ending at 2009 UTC 11 June 2003) Storm Total Precipitation (0708 10 June 2003 to 2009 UTC 11 June 2003) St. Louis, MO (KLSX)
Radar Precipitation Estimation Caveats • No control over STP estimation interval • Based on empirically-derived formula • not always ideal for given area/season/character • Hail contamination • (large) water-covered ice pellets very reflective • causes overestimate of precip intensity/amount • Mixed precipitation character in same area • convective and stratiform precipitation falling simultaneously • which Z-R relationship applies? • Patterns generally good, magnitudes less so
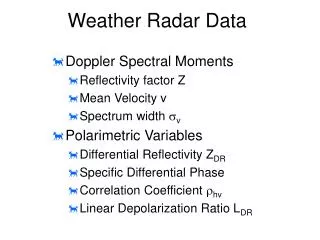
Doppler Effect • Based on frequency changes associated with moving objects • E-M energy scattered by hydrometeors moving toward/away from radar cause frequency change • Frequency of return signal compared to transmitted signal frequency radial velocity