Statistical Inference for Mean Contamination Level in Farmed Salmon
130 likes | 224 Vues
Analyzing mean mirex concentration in farmed salmon to determine contamination level exceeding EPA guidelines. Hypothesis testing and inference procedure explained with statistical mechanics and conclusion.

Statistical Inference for Mean Contamination Level in Farmed Salmon
E N D
Presentation Transcript
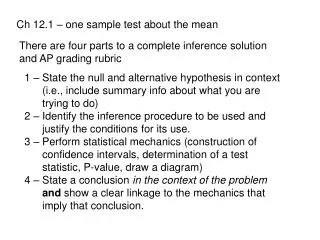
Ch 12.1 – one sample test about the mean There are four parts to a complete inference solution and AP grading rubric 1 – State the null and alternative hypothesis in context (i.e., include summary info about what you are trying to do) 2 – Identify the inference procedure to be used and justify the conditions for its use. 3 – Perform statistical mechanics (construction of confidence intervals, determination of a test statistic, P-value, draw a diagram) 4 – State a conclusion in the context of the problem and show a clear linkage to the mechanics that imply that conclusion.
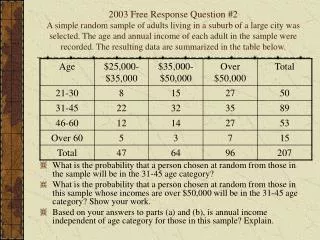
Example Researchers randomly purchased and checked 150 farmed salmon from 51 farms in eight regions. The fish were analyzed for 14 organic contaminants, one of which was the carcinogen mirex. They found the mean concentration of mirex to be 0.0913 parts per million, with a standard deviation 0.0495 ppm. As a safety recommendation to recreation fishers, the EPA ‘s recommended ‘screening value’ for mirex is 0.08 ppm. The histogram of the data was unimodal and a bit skewed to the right. Are farmed salmon contaminated beyond the level permitted by the EPA?
I want to know whether the mean concentration of mirex in farmed fish exceed the EPA value of 0.08 ppm. Ho: µ = 0.08 Ha: µ > 0.08 Since I do not know the standard deviation in the population of farmed salmon, I will use the one-sample t test. The fish were randomly selected, near Normality was given but the sample size, 150, was large enough (the sample size is less than 10% of the population), and the fish were raised and purchased independently from several locations.
Mechanics n = 150, df = 149, = 0.0913, µ = 0.08, s = 0.0495 Make sure you include a diagram showing where the P-value is. P-value = 0.0029 With a P-value this low, I reject the null hypothesis and conclude that, in farm-raised salmon, the mirex contamination level does exceed the EPA screening value.
Paired t Tests The paired t test is used to analyze paired data. The first step is to take the difference within each pair to produce a single sample. Then use the one-sample t procedure.
12.2 Tests about a Population Proportion IMPORTANT NOTE: For confidence intervals we use the standard error: whereas for a test of Ho:p = po we use . We use all of the information available for our calculations.
For a confidence interval, p is unknown and the standard error must, therefore, be estimated using the value of obtained from the data. On the other hand, when testing Ho:p = po, our calculations are based on the assumption that Ho is true and, therefore, we use the value po in the calculations. Bottom line: Use for confidence intervals and po for significance tests.
Example: A coin that is balanced should come up heads half the time in the long run. The French naturalist Count Buffon (1707 – 1788) tossed a coin 4040 times. He got 2048 heads. The sample proportion of heads is That’s a bit more than half. Is this evidence that Buffon’s coin was not balanced?
Step 1: Ho: p = 0.5 Ha: p ≠ 0.5 p = 0.5 means the coin is balanced. Step 2: Use a one-proportion z test SRS – tosses can be considered an SRS Normality – npo=(4040)(.5) = 2020≥10 n(1-po) = (4040)(.5) = 2020≥10 Independence – tosses are independent
Step 3: 2 sided, P-value = 0.3783
Step 4: A proportion of heads as far from .5 as Buffon’s would happen 38% of the time when a balanced coin is tossed 4040 times. This provides little evidence against Ho. I fail to reject the null hypothesis.
What if you wanted to see what values of p are consistent with the sample results? You would use a confidence interval. Let’s look at a 95% confidence interval.
We are 95% confident that the probability of heads is between 0.492 and 0.522.