Download
1 / 22
220 likes | 385 Vues
Data rich but information poor, how to FOCUS on the activity using clinical dashboards May 2013. What is a Clinical Dashboard?.

E N D
Data rich but information poor, how to FOCUS on the activity using clinical dashboards May 2013
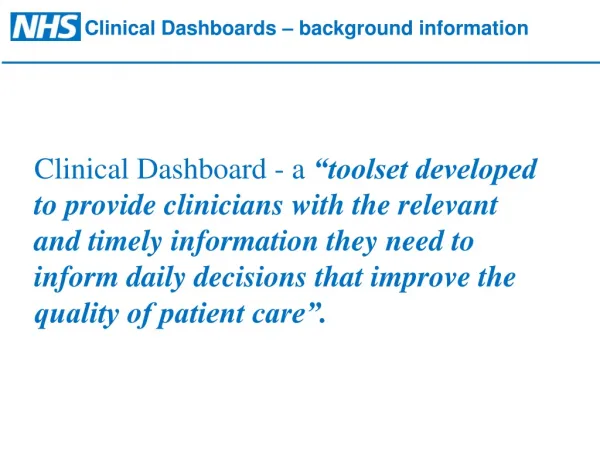
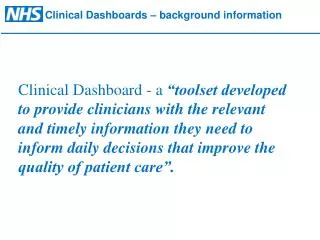
What is a Clinical Dashboard? • A toolset of visual displays developed to provide clinicians with the relevant and timely information they need to inform daily decisions that improve quality of patient care. • Makes vital information available without speaking a word
Pause to consider • What metrics indicate the department is performing well? • What are the process characteristics and attributes necessary to achieve those outcomes? • What are specific behaviours and tasks necessary to achieve those outcomes?
Why visual management • “ You can’t manage what you can’t monitor”- like steering a boat by looking at the wake • “ We are data rich but information poor” • What gets measured visually gets managed in real time. • Ask yourself three questions: • What is the purpose? • Who is it for? • How often do you use and/or respond to indications of abnormality? • Dave Logazzo
We are data rich but information poor • Clinical Dashboards provides clinicians with: • a panoramic and granular views of their workplace. • an ability to see what was previously invisible improves operations, customer experiences, and strategy. • creative ways to identify usable data you already have.
Transition To From
Using data and analytics • Identify, combine, and manage multiple sources of data • Need the capability to build advanced analytics models for predicting and optimizing outcomes • Management teams must possess the knowledge to transform their workplaces so that the data and models actually yield better decisions.
Visual Management • If multiple people asks you the same question consider a visual tool • "If I can see it, I can fix it." Dr Thoralf Sundt Mayo Clinic • “It's hard to fix what you can't see” John Shook
What were our hypotheses The Clinical Dashboard will allow clinicians to look at ways to improve care by observing areas for improvement, make relevant changes to processes and see the impact of the changes they have made. Problems will highlighted as they arise, enabling and encouraging individuals and teams to tackle them right away.
Clinical Dashboard Variety of widgets
Other widgets We are currently working on a variety of other widgets, these include: Waiting for what Allied health Sub acute service • Insert from allied health • Sub acute • Use premiers award submission
Clinical Dashboards help to drive process improvements by: • Providing timely, relevant informationpresented in easy to understand format, with high visual impact, • Utilising multiple sources of existing data, • Providing clinical information for multidisciplinary team, • Displaying information in ‘real time’ .
Critical Success Factors Clinicians select the metrics that define the performance of their service Existing data is converted to high-value information presented without delay Clinical team commitment to change is fundamental requirement. Dashboard development has been iterative, dynamic ‘agile’ and responsive to clinical review. Dashboard is located within the clinical unit with local decision makers viewing.
What are the benefits so far? • Clinicians agree that the clinical dashboard: • metrics help monitor the key quality and productivity drivers of our service, • enables the use of information that was not previously available, • make it easier to see where change should be focused to help solve local issues around the NEAT. • Improved local clinician engagement and cooperation, raising the quality of care
Recommendations • With well motivated local clinical leadership, a clinical dashboard can help staff to view the current situation and deliver significant improvements in the quality of patient care and also improve the efficiency of their services.
The Future Clinical Dashboard? Capacity of many widgets with clear directions for other developers to add additional widgets
The future will include other clinical metrics • Quality • Unplanned Re-admissions 7 and 28 day • Waiting for what • Safety • Number of patients as outliers/ program • Operational Effectiveness • Occupied beds per care hours • Current rostered vs actual hours compared to target care hours. • Patients awaiting sub acute care
Acknowledgements • Metro North- Innovation funding • Queensland Health Clinical Access Redesign Unit • Clinicians and Managers of the General Medicine Program –TPCH • Business Solutions Unit Metro North Hospital and Health Service. • PwC Brisbane
Questions http://www.youtube.com/watch?v=_SQ6uXO1EiM