SERS-based Biosensors
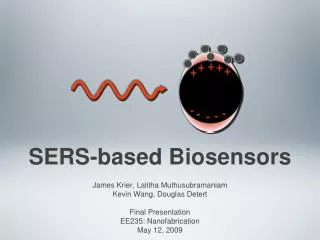
SERS-based Biosensors. James Krier, Lalitha Muthusubramaniam Kevin Wang, Douglas Detert Final Presentation EE235: Nanofabrication May 12, 2009. Overview. Technology Landscape: Optical techniques for biosensing Surfaced-enhanced Raman scattering ( SERS ) Technical background

SERS-based Biosensors
E N D
Presentation Transcript
SERS-based Biosensors James Krier, Lalitha Muthusubramaniam Kevin Wang, Douglas Detert Final Presentation EE235: Nanofabrication May 12, 2009
Overview • Technology Landscape: Optical techniques for biosensing • Surfaced-enhanced Raman scattering (SERS) • Technical background • SERS-based biosensors • Financial and market considerations of SERS
Vast Technology Landscape Diverse Applications
Total internal reflectance fluorescence (TIRF) biosensor TIR Evanescent wave http://www.microscopyu.com/articles/fluorescence/tirf/tirfintro.html
Epifluorescence TIRF Typical TIRF Sensogram Advantages High Signal to noise ratio (very little secondary emission from bulk solution) Highly robust, low cost, portable Drawbacks Need for labels High cross-reactivity (hence not easy to multiplex) http://www.tirftechnologies.com/principles.php
Molecularly Imprinted Polymers as Optical Sensors Schematic representation of molecular imprinting Distribution of binding affinities in MIP vs. Ab Chemical Reviews, Chem. Rev.,100 2495 (2000)
3 methods to monitor binding in MIPs • Direct monitoring of analyte in solution; Incorporation of spectroscopically responsive monomers into the matrix;Competition assays using labeled ligands Polymer International, Vol 56( (4), pp. 482-488
Reflectometric interference spectroscopy (RIFS) • The reflected beams superimpose and change optical thickness of the transducer by binding events onto the surface. Shift in characteristic interference spectrum is transformed into a signal curve. J. Immunological Methods Vol 292, Issues 1-2, September 2004, pp.35-42
Reflectometric interference spectroscopy (RIFS) Protein concentration determined spectrophotometrically and active antibody concentration determined by biosensor and ELISA for 9 sequentially eluted fractions. J. Immunological Methods Vol 292, Issues 1-2, September 2004, pp.35-42
The SERS Solution Adsorption Excitation Detection
Raman Spectroscopy C.V. Raman http://www.kamat.com/database/content/pen_ink_portraits/c_v_raman.htm Adapted from http://upload.wikimedia.org/wikipedia/commons/8/87/Raman_energy_levels.jpg
adenine cytosine guanine thymine uracil Raman Spectroscopy • Selection rules • Based on symmetry elements of polarizability tensor • Vibrational fingerprint • Comprised of narrow spectral features • Robust mechanism • Not subject to photobleaching • Weak Signal • Compared to Rayleigh scattering / fluorescence Provides rich info. about structural data! Gelder, et al., J. Raman Spectrosc., 38 1133 (2007) A. Campion et al., Chem. Soc. Rev.,27 241 (1998)
Surface-Enhanced Raman Scattering M. Fleischmann, et al., Chem. Phys. Lett., 26 163 (1974) D.L. Jeanmaire, R.P. Van Duyne, J. Electroanal. Chem., 84 1 (1977) M.G. Albrecht, J. A. Creighton, J. Am. Chem. Soc., 99 15 (1977) S. Schultz, et al., Surface Science,104 419 (1981) M. Moskovits, , Reviews of Modern Physics, 57 3 (1985) K. Kneipp, et al., Chem. Rev., 99 2957 (1999)
Away from plasmon resonance At plasmon resonance SERS Enhancement • Chemical Enhancement • Based on metal-molecule charge-transfer effects • Electromagnetic enhancement • Coupled to surface plasmon excitation of metal nanostructures Tunable resonances: Shape- and Size-effects A.J. Haes, et al., Anal. Bioannal. Chem., 379 920 (2004) S. A. Maier, et al., Adv. Mater., 13 1501 (2001)
10-250 nm SERS Enhancement Enhancing SERS substrates • Plasmon resonance leads to local field enhancement near the surface • Adsorbed molecules see increased field • Raman signal enhancement (up to 1015) • Depends on local geometry of adsorption site K. Kneipp, et al., Chem. Rev., 99 2957(1999) J. Aizpurua, et al., Phys. Rev. Lett., 90 057401-1 (2003)
1500 cm-1 1532cm-1 1600cm-1 1635cm-1 The SERS Advantage • Molecular fingerprinting • Unique vibrational spectra distinguishes molecules • Tagless biosensing • Fluorescent dyes are not needed • Multiplexed sensing • Plasmon resonances allow for sensor tunability • In vivo applicability • Near-IR excitation and biocompatability allow • Femtomolar and beyond • Single molecule spectroscopy is possible S.M. Nie, et al., Science, 275 1102 (1997) http://www.oxonica.com/diagnostics/diagnostics_sers_imaging_applications.php
Single Molecule Detection PRL 78, 1667 (1997)
TERS nanowerk.com
TERS Faraday Discuss., 132, 9 (2006)
TOPOGRAPHY + SPECTROSCOPY PRL 100, 236101 (2008)
In-vivo glucose sensing Faraday Discuss., 132, 9 (2006)
Other Options PRL 62, 2535 (1989).
More Moerner et al. Nature 402, 491 (2000).
NSOM JPC 100, 13103 (1996)
SERS Market • Consumables $50 to $750 per analysis $1 million market annually • Instrumentation $10,000 - $180,000 Image source: http://senseable.mit.edu/nyte/visuals.html (New York Talk Exchange) Numbers: http://www.thefreelibrary.com/Market+profile:+SERS-a0137966471
SERS Companies • Bruker Optics • D3 Technologies (Mesophotonics) • Oxonica • Renishaw • Real Time Analyzers http://www.brukeroptics.com/raman.html
SERS Vials • Real Time Analyzers • Sol-gel of Au or Ag nanoparticles • 106 signal enhancement www.rta.biz
Portable Raman • Real Time Analyzers RamanID • DeltaNu Inspector Raman Diesel Fuel Spectrum
SPR Companies • Biacore (GE) • Biosensing Instrument • FujiFilms • GWC Technologies • Ibis • Sensiq
SPR Analyzer • Biosensing Instrument BI-2000 • Cost: $39k • Liquid/Gas Detection • 10-4 degree sensitivity
Conclusion: SERS • Even simple (diatomic) molecules can have complex and reproducible vibrational fingerprints • The most practical option for sensing near the single-molecule level for a variety of analytes in solution or air, lending to an array of applications ranging from trace gas detection to automated protein identification • Easy to couple with other supplementary techniques (e.g., AFM) • Provides an economically feasible sensing mechanism for portable devices in atmospheric conditions