Download
1 / 55
550 likes | 649 Vues
Learn about IPA tools for network construction, genomic data interpretation, and hypothesis generation in biomedical research. Explore how IPA facilitates understanding of gene/protein interactions and aids in experimental design. Discover the power of IPA in analyzing -omics data and constructing model networks to drive research focus. Find connections, predict upstream regulators, and identify pathways affected by gene/protein interactions with IPA.

E N D
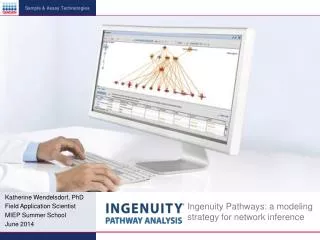
Ingenuity Pathways: a modeling strategy for network inference Katherine Wendelsdorf, PhD Field Application Scientist MIEP Summer School June 2014
Getting started:Network Construction with IPA Katherine Wendelsdorf, PhD Field Application Scientist MIEP Summer School June 2014
What is Ingenuity Pathway Analysis [IPA]? • Gene/proteins of Interest • Given a large set of gene/proteins that are activated/inhibited affected • What are likely downstream effects? • disease phenotypes, impact on cell functionality • What specific pathways are likely being affected? • What upstream regulators are involved?
A knowledgebase (KB) that’s 15 years in the making • Unprecedented Access to Literature Knowledge Literature findings The Ingenuity Knowledge Base Biomedical Ontology MD/PhD level curators The Ingenuity Ontology Proprietary and Confidential
IPA:Tools for Genomic Data Interpretation Gene View Summaries Gene View Summaries Human Isoform Views Human Isoform Views Interaction Networks Interaction Networks Biological Functions Biological Functions Canonical Pathways Canonical Pathways Upstream Regulator Analysis Upstream Regulator Analysis Build & Overlay Tools Build & Overlay Tools miRNA-mRNA Relationships miRNA-mRNA Relationships
IPA and Model Networks • What we need network models for: • Provide a framework for organizing existing data, • Generate novel mechanistic hypotheses • Determine focus of validation experiments in time and space. -omics data Computational Model/Simulation GENERATION of HYPOTHESES for experimental testing
IPA and Model Networks • What we need network models for: • Provide a framework for organizing existing data, • Generate novel mechanistic hypotheses • Determine focus of validation experiments in time and space.
IPA and Model Networks • What we need network models for: • Provide a framework for organizing existing data, • Generate novel mechanistic hypotheses • Determine focus of validation experiments in time and space.
IPA and Model Networks What we need network models for: • Provide a framework for organizing existing data, • Generate novel mechanistic hypotheses • Determine focus of validation experiments in time and space. -omics data
IPA and Model Networks • What we need network models for: • Provide a framework for organizing existing data, • Generate novel mechanistic hypotheses • Determine focus of validation experiments in time and space. Making Networks with IPA: • Data- independent methods: Search and Explore • Omics Data-derived networks: Core Analysis • Gene expression, methylation, proteomics, etc. • New stuff: Advanced Analytics
Search & Explore- Exercise Build a network based solely on current literature: • Mechanism for ‘increased Th17’ observation • How could this be connected to colitis? • What would be the effect of different interventions? YOU DON’T HAVE TO REMEMBER EVERY STEP!!! TUTORIALS/RESOURCES ARE AVAILABLE Title, Location, Date
Search & Explore- Build Tools • Networks based solely on current literature • Connect:Connects molecules given the criteria that the user specifies • Grow: Adds new molecules and their relationships given the criteria that the user specifies • Path Explorer: Calculates the “Shortest Path” between 2 molecules or 2 sets of molecules • Add Molecule/Relationship: Allows adding a custom molecules or relationship to the current pathway that does not exist in Ingenuity’s KB as well as ones that already exist • Trim:Removes molecules/relationships that meet the criteria that the user specifies • Keep: Keeps molecules/relationships that meet the criteria that the user specifies INGENUITY PATHWAY ANALYSIS 13
Search & Explore- Overlay Tools • Networks based solely on current literature • Analysis/ Dataset: Expression/data values that have been uploaded into IPA • MAP (Molecule Activity Predictor): To predict upstream / downstream effect of activation or inhibition on unknown molecules • Drug: Known drugs that target the molecules on the pathways • Function & Disease: Functions and Diseases that overlap • Canonical Pathway: Canonical Pathways that overlap • Highlight: Outline molecules that match specified criteria • My List/My pathway: User created lists/pathways saved within IPA that overlap INGENUITY PATHWAY ANALYSIS 14
Search & Explore Networks based solely on current literature • Organize existing data: Visualize what is currently known in the literatureand databases. • Novel mechanistic hypothesis: Once have calibrated and have added the dynamics: Does what we know in the literature support what is happening in our system over time/space? • Where to focus: Hubs, most influential interventions, indirect connections, etc. Resources Help > Help and Support > Training Ingenuity Pathway Analysis – Finding The Connections
Peer-reviewed publications citing IPA • 10,000+ Published Studies Citing IPA • Sorted by Research Area, Through December 2013 INGENUITY PATHWAY ANALYSIS
Peer-reviewed publications citing IPA • Breakdown by Experimental Platforms Through December 2013 INGENUITY PATHWAY ANALYSIS
Data Upload- Data format supported • Two file formats: • Excel spreadsheet (single sheet only) • tab delimited text file • One ID columnand header row • Multiple observationor single observation INGENUITY PATHWAY ANALYSIS
Supported identifiers for data upload *Primary mapping to Entrez Gene INGENUITY PATHWAY ANALYSIS
Data Upload- Instructions • Data upload and Core Analysis steps: http://ingenuity.force.com/ipa/IPATutorials# Tutorials and Training > Upload and Analyze Example Data Tutorial
Sample Dataset- TNF treated HUVECs Authors wanted to see effects of inflammation factor tumor necrosis factor (TNF) on macrovascular human umbilical vein ECs (HUVEC) HUVEC were left untreated or stimulated in triplicate for 5h with 2 ng/ml TNF Gene expression fold change treated vs. untreated • Uploaded Dataset already at: My Projects > Example Analyses > Datasets > TNF treated HUVECs GSE2639.txt
Creating an IPA Core Analysis: Using Filters Several filters available. Set criteria to filter out findings of less interest. Set data cutoff filters INGENUITY PATHWAY ANALYSIS
Open a Core Analysis • Core Analysis already available at: My Projects/ Example Analyses/ Analyses/ TNF treated HUVECs GSE2639 INGENUITY PATHWAY ANALYSIS
Canonical Pathway Analysis • Biological pathways enriched in my dataset? • Which genes in a pathway are affected and what effect might that change have on the pathway?
Upstream Regulator Analysis • Filter to the most relevant molecules causing expression changes INGENUITY PATHWAY ANALYSIS
Upstream Regulator Analysis • Filter to the most relevant molecules causing expression changes INGENUITY PATHWAY ANALYSIS
Downstream: Disease and Functions • Interpret Downstream Biological Functions INGENUITY PATHWAY ANALYSIS
Regulator Effects • Upstream regulators likely causing predicted the downstream effect Score Regulators Targets Diseases & Functions Ingenuity Pathway Analysis – Finding The Connections Ingenuity Pathway Analysis – Finding The Connections
Regulator Effects • Upstream regulators likely causing predicted the downstream effect Score Regulators Targets Diseases & Functions Ingenuity Pathway Analysis – Finding The Connections Ingenuity Pathway Analysis – Finding The Connections
Concept of “Regulator Effects” - Spring 2014 • Alternate presets to answer different questions Transcription factors and functions Compound as regulator of functions Minimal regulator to function networks Ingenuity Pathway Analysis – Finding The Connections
Network Export • Get the network out of IPA: • Image • Text file • Email to Colleague • Print directly • Read in to other tools: COPASI, CellDesigner • Manually • Minor scripting
Core Data Analysis- Exercises Create Networks to identify/explain TNF effect on HUVEC cells Canonical Pathways Upstream Regulators/ Mechanistic Networks Diseases/Functions in Search&Explore Regulator Effect Networks
Core Data Analysis- Summary • IPA Analysis Tools • Canonical Pathway Analysis • Predicts pathways that are changing based on your dataset • Predict directional effects on the pathway molecules not in dataset (MAP overlay tool) • Upstream Regulator Analysis • Predicts activated/inhibited regulators responsible for observed data • Creates de novo pathways based on upstream regulators (Mechanistic Networks) • Diseases and Functions Analysis • Predicts the directional biological effects (cellular processes, biological function) of gene/protein set • “Increase in cell cycle” • “Decrease in apoptosis” • Regulator Effects • Identifies plausible hypothesis: specific upstream regulator pathways leading to a downstream phenotype.
INGENUITY Pathway Analysis Comparison Analysis for multi-observations INGENUITY PATHWAY ANALYSIS
Data Upload- Data format supported • Multiple observationdatasets • Timecourse: 12hr, 24hr, 48hr • Treatment panels: IL-10, TNF, IL-4+IL-13 INGENUITY PATHWAY ANALYSIS
Comparison Analysis : Pathway • Quickly visualize trends across time points or dose response Visualize expression changes across the pathway for each dose/time point INGENUITY PATHWAY ANALYSIS
Comparison Analysis : Diseases & Functions INGENUITY PATHWAY ANALYSIS
Comparison Analysis : Upstream Regulators INGENUITY PATHWAY ANALYSIS
INGENUITY Pathway Analysis Advanced Analytics INGENUITY PATHWAY ANALYSIS
Advanced Analytics • Bioprofiler: • Identify list of compelling genes/proteins/compounds to analyze • Data-independent • Causal Networks: • Obtain list of plausible Master Regulators along with mechanism • Data-derived Ingenuity Pathway Analysis – Finding The Connections
Bioprofiler- Advanced Analytics What genes/proteins/comopunds do I want to measure in my experiment? Get access to Ingenuity’s Knowledge Base: Targets of toxicity: Which genes when decreased in activity increaseliver cholestasis? What types of [genetic] evidence support this? Target discovery: What heterozygous knockouts in mouse can decreaseasthma?Which drugs or which targets have been in late stage clinical trials or approved to decrease diabetes? Biomarker research: Which genes are potential diagnosis OR prognosis biomarkers of breast cancer and are upregulated in breast cancer? INGENUITY PATHWAY ANALYSIS
BioProfiler: Find, Filter and Explore Ingenuity Pathway Analysis – Finding The Connections
BioProfiler: Find, Filter and Explore Ingenuity Pathway Analysis – Finding The Connections
Causal Networks- Advanced Analytics • Identify likely, relevant root regulators Causal Network Oxidation of lipid Causal Network Scoring Casual connection to disease, function, or gene of interest *Available at additional cost INGENUITY PATHWAY ANALYSIS
Upstream Analysis • Power to explain expression changes Upstream Regulators Mechanistic Network Upstream Regulator A Upstream Regulator A Upstream Regulator:TF B Targets in the dataset Significant Overlap in the Regulation Causal Networks C Master Regulator Scoring Casual connection to disease, phenotype, function, or gene of interest Regulator (s) are not require to share a significant overlap in the dataset regulated genes. TF Ingenuity Pathway Analysis – Finding The Connections
INGENUITY Pathway Analysis microRNA Target Filtering INGENUITY PATHWAY ANALYSIS
microRNA Target Filter • Identify relevant microRNA targets microRNA measured Relationship Target mRNA Target Info *Available at additional cost INGENUITY PATHWAY ANALYSIS
microRNA Target Filter • Identify relevant microRNA targets microRNA measured Relationship Target mRNA Target Info *Available at additional cost INGENUITY PATHWAY ANALYSIS
IPA and Model Networks What we need network models for: • Provide a framework for organizing existing data, • Generate novel mechanistic hypotheses • Determine focus of validation experiments in time and space. Making Networks with IPA: • Data- independent methods: Search and Explore • Omics Data-derived networks: Core Analysis • Gene expression, methylation, proteomics, etc. • New stuff: Advanced Analytics • Additional features: microRNA target filter, Comparison Analysis