Download
1 / 30
300 likes | 383 Vues
This study presents findings from a West Coast drift card study focusing on biological transport patterns. Results reveal return rates, recovery times, and seasonal dispersal patterns from three bays. Limitations, applications, and future research implications are discussed.

E N D
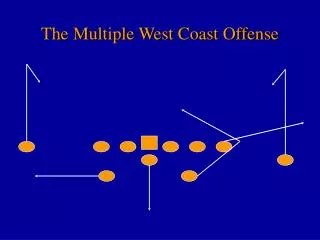
Inferences for Biological Transport:Results from a West Coast DriftCard Study Vanessa M. Howard & Mark Sytsma Portland State University Alternative Ballast Water Exchange Areas Workshop June 21, 2006 – Seattle, Washington
Outline Background Methods Results Return rates & recovery time Recovery patterns - spatial & seasonal Summary
Schwartzlose 1963 Background www.noaanews.noaa.gov Circulation patterns/currents (Schwartzlose 1963, Heath 1969, Dewees & Strange 1984) Situation of marine protected areas (Klinger & Ebbesmeyer 2001) Sewage outfall(Crone et al 1998, Sauers et al 2001) Floating materials hypothetical oil spill (NOAA’s 2005 Safe Sancuary Drill in FL Keys NMS) floating pollutants (NOAA’s 2002-04 Hawaii Drift Card Study)
Photo courtesy of NRCS Objectives • Understand potential seasonal &/or spatial patterns of ocean dispersal from three heavily infested bays • Understand relative risk posed by various Spartina species • Identify common debris collection zones • Education & outreach
Methods – Card Design • Buoyant plywood cards (10 cm x 15 cm) • Biodegradable - designed to persist 3-6 months • Coded for release date and location • NOAA specifications (Oahu, Hawaii Drift Card Study 2002-2004)
Willapa Bay Humboldt Bay San Francisco Methods – Releases • Three release locations • September 2005 through August 2005 • 200 cards • Within two hours of high tide
Results – return rates Willapa 41.8%
Results – return rates Humboldt 26.2%
Results – return rates San Francisco 43.8%
WB releases • Max North ~ 2,000 km (129 days) • Max South ~ 300 km (227 days)
HB releases • Max North ~ 2,800 km (214 days) • Max South ~ 530 km (45 days)
SF releases • Max North ~ 630 km (56 days) • Max South ~ 400 km (151 days)
Known S. alterniflora x foliosa hybrid SF releases Seasonal Patterns
Discussion Limitations: • Simulates surface transport only • Does not account for life history or behavior • May underestimate velocities • Does not account for inter-annual variation Applications: • Knowledge of near-shore, coast-wise transport • Emphasizes seasonal nature of dispersal • Identifies likely collection zones • Inexpensive - allowing greater numbers of replicates
Summary • Drift from these three locations has a large seasonal component, generally following known patterns of ocean currents • Highest northward velocities & transport seen in WB & HB winter releases • Lower velocities & transport from SF • Local deposition more likely than distant, although rapid long-distance transport seen in certain instances • Question of transport into estuaries? • Additional releases of drift cards may help identify collection zones
Acknowledgements Funding San Francisco Estuary Institute Oregon Department of Agriculture Washington Department of Fish & Wildlife Collaborators Kristen Ward, Golden Gate National Recreation Area (NPS) Travis Haring, Russell Nunez, Les Holcomb and David Heimer, WDFW Bill Pinnix, USDFW - Arcata office Volunteers Beachwatch (CA) COOAST (WA & OR) SOLV (OR) Beachcombers, tourists, children & many others