Download

1 / 20
200 likes | 379 Vues
SCILOV-10 Validation of SCIAMACHY limb operational BrO product. F. Azam , K. Weigel , A. Rozanov , M. Weber, H. Bovensmann and J. P. Burrows ESA/ESRIN, Frascati , Italy 27-02-2014. Contents: SCIAMACHY ESA vs IUP (datasets) Validation Strategy BrO Inter-comparisons

E N D
SCILOV-10 Validation of SCIAMACHY limb operational BrO product F. Azam, K. Weigel, A. Rozanov, M. Weber, H. Bovensmann and J. P. Burrows ESA/ESRIN, Frascati, Italy 27-02-2014
Contents: • SCIAMACHY ESA vs IUP (datasets) • Validation Strategy • BrO Inter-comparisons • Conclusion/Outlook 1
ESA /DLR vs IUP BrO: main retrieval differences ESA/DLR IUP Processors: Speed Optimized Precision optimized Pre-processingno yes auxiliary spectral fits for each tangent height independently, (improves quality of spectra) Spectral range 337–357 nm 338-356.2 nm Climatology/a prioriConstant a priori Latitude dependent in vmr climatological information Regularization Optimal regularization weak statistical parameter using L- curve regularization method (smoothness constrain) See for details; Rozanov et al, Atmos. Meas. Tech., 4, 1319–1359, 2011 * L-curve: too strong regularization with deteriorating vertical resolution and large smoothing errors 2
Validation Strategy • SCIAMACHY limb coverage: • Profiles/day:1500 profiles for Aug 2002 - Apr 2012:above 4.5 million • (IUP SCIAMACHY BrO ¼ of the amount, the profiles are retrieved as an average of the four azimuth) • Data versions: ESA/DLRBrO version 5.02 and IUP version 3.2 • Sub-sampling: • ESA SCIAMACHY Sub-sampling (allows for faster computation): • Distance between two profiles is set larger than 5000 km • A profile is not allowed in the same 5° latitude band as any of 26 profiles • before • Each latitude band is limited to 20% more profiles than the average 3
Validation Strategy • Subsampling results in 3% of the entire datasets well distributed over all latitudes, longitudes and time • ESA – IUP Collocation criteria: time = 0.001 h, distance= 1000 km • One randomly chosen profile from each state of ESA is compared to the single IUP profile. 4
ESA/DLR v5.02 –IUP v3.2 Profile comparisons • mean • relative • differences • Tropics • Near global • NH mid lat. • SH mid lat. • NH high lat. • SH high lat. 6
Tropics Annual cycle and Time series 7
NH Time series 8
SH Time series 9
Profile comparisons have large standard deviation. Very large differences • (30-40%) observed for the high lat. • BrOseasonal cycle from the two dataset seems to be anti-correlated • Probable factors contributing to differences; • i)- different climatologies used in the ESA/DLR and IUP retrieval • ii)- differences in regularization used as smoothness constrain • MLS, OSIRIS and SMILES also provide BrO data but that could not be used • for comparisons • MLS: no altitude overlap, BrO measurements start around 30 km • OSIRIS: provides BrO amounts as daily zonal means and • SMILES: time span is too short, Oct.2009 – Apr. 2010 9
Large differences cannot be accounted for by the statistics used • Data quality of the ESA/DLR and IUP datasets were investigted by examining the averaging kernelsand the measurment content of the retrieval • Averaging kernels: • Give the sensivity of the retrieval to the true state • Measurement content: • The degree of contribution of the retrieval to the true state. Calculated as an integral of the rows of the averaging kernels, when it is 1, no contribution from a priori. • Resolution: • The width of the averaging kernel provides information on the vertical resolution 10
BrO Averaging Kernels: • ESA • Tropics (Jan) • IUP 11
BrO Averaging Kernels: • ESA • Arctic (Jan) • IUP 12
BrO Averaging Kernels: • ESA • Antarctic (Jun) • IUP 13
Conclusions/Outlook • ESA/DLR BrO v5.02 compared with IUP data version 3.2 • Profiles comparisons showed very large differences (30-40%) for the high lat. between the two SCIAMACHY datasets • Time series showed clear seasonality in differences for mid and high lat. • Diagnostic study carried out on the quality of the datasets, investigating their averaging kernels and the measurmenent content • ESA/DLR retrieval has the maximum of the retrieval sensitivity ~ 25 km where less than 50% of the information comes from the measurements. • IUP BrO retrieval sensitivity has its maximum around 20 km where the measurement contributes to 60-65% of the retrieval. • 14
Outlook/Recommendations • For ESA/DLR limb BrO,retireval should be precision optimized, care with the climatology used in the retrieval, S/N ratio needs to be improved. • 15
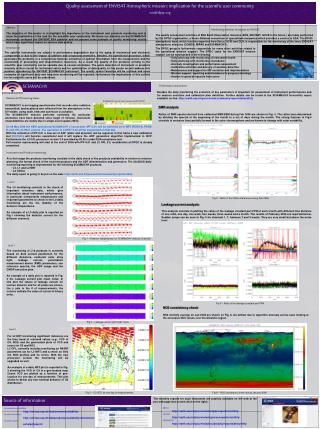
Results Profile comparisons: mean relative differencesplots with the standard deviationof the bias corrected differences for 20-35 km Annual cycles: annual cycle vs altitude plots as monthly mean absolute amounts, monthy mean percental difference and the monthly mean percental differences for selected altitudes (20, 24, 27 and 31 km) Time Series: compared for 20–35 km on a monthlygrid. For the selected altitudes (20, 24, 27 and 31 km), comparisons carried out on 30 days running averages if more than 10 collocations are found
ESA • Tropics • (Jun) • IUP
L-curve method A compromise between precision and resolution Produces too strong regularization with deteriorating vertical resolution and large smoothing errors 4