Download
1 / 16
160 likes | 284 Vues
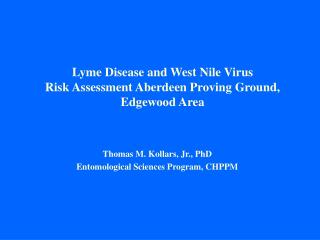
Lyme Disease and West Nile Virus Risk Assessment Aberdeen Proving Ground, Edgewood Area. Thomas M. Kollars, Jr., PhD Entomological Sciences Program, CHPPM. Lyme Disease Risk Model. 1. Study conducted June 2001 through April 2002 2. Sites – 10 areas, 3 habitats Wooded Ecotone Field

E N D
Lyme Disease and West Nile VirusRisk Assessment Aberdeen Proving Ground, Edgewood Area Thomas M. Kollars, Jr., PhD Entomological Sciences Program, CHPPM
Lyme Disease Risk Model • 1. Study conducted June 2001 through April 2002 • 2. Sites – 10 areas, 3 habitats • Wooded • Ecotone • Field • 3. Environmental Variables • Elevation (min, max, mean) • Habitat Type • Tree Density • Canopy Cover • Shrub • Herbaceous • Monocot • Fern
Regression Analysis of adult I. scapularis and Habitat Variables
Based upon shrub density as correlated with adult Ixodes scapularis using regression model When mean of 200 sample points are used/10m intersect R sqr. =0.87 F (1, 18)=120 P<0.001
Lyme Disease Risk Assessment Edgewood Area from adult Black-legged Ticks >1 Tick >.5 and < 1 Tick < .5 Tick
Accuracy of Lyme Disease Risk Model based on shrub density Model tested in March/April 2002 34 sites 2m2 dragged 1= <17 shrub 2= 17-25 3>25 shrubs
Comparison of adult I. scapularis among soil types using ANOVA and LSD (where > 6 samples were taken) • Mpb Matapex silt loam 2%-5% slope, mean 0.57 • Roa Romney and Elkton soils, cratered, mean 0.32 • Ud Udorthents, loamy, 0 to 10 % Slopes, mean 0.12 • BeB Beltville silt loam, 2 to 5 % slopes, mean 0.23 • MU Mattapex-Udorthents-Urban, 0 to 2 % slope, mean 0.00 • BeA Beltville silt loam, 0 to 2 % slopes, mean 1.00 • Ot Othello silt loam, mean 0.0
Risk assessment of adult I. scapularis based on soil type at Edgewood area (APG) (p<0.05) 1 tick per 4m2 1 tick per 9m2 1 tick per 17m2
Risk Assessment Map of Aberdeen Proving Ground based upon extrapolated adult Black-legged Tick and Soil Classification 1 tick per 4m2 1 tick per 9m2 1 tick per 17m2
West Nile Risk Assessment • 10 study areas, 3 habitats each 2001 • June 0330 –0730 identify bird species • July through October - Landing counts 0600-0730 • Model using Sugeno and Takagi Fuzzy Reasoning
West Nile Virus Potential At Edgewoodbased upon Sugeno and Takagi Fuzzy ReasoningBird Risk = (fuzzy (wnv antibody x flock)) = BRMosquito Risk = (fuzzy (ornithophilic x homophilic)) = MR1 = BR1(BRO) MR1(MRO)min {High (BRO), High (MRO)}= 0.752 = BR2(BRO) MR2(MRO)= min {Moderate (BRO), Moderate (MRO)}= 0.5High WNVP1 = High (BRO) + High (MRO)= 1.60 + 2.05= 3.65Moderate WNVP2 = Moderate (BRO) + Moderate (MRO)= 1.40 + 1.37= 2.77Control Measures Should Be Implemented When WNVP =0 = 11 + 22 / 1 + 2= 4.12 / 1.25= 3.3
West Nile Risk Assessment Edgewood Area Using Fuzzy Logic Model IPM Mosquito Control Continuous Surveillance Periodic Surveillance
Continuing Surveillance • Tick-borne Disease surveillance • Continue to refine adult black-legged tick prediction • Identify variables associated with immature tick populations • Identify variables associated with other tick species • Test infection rates of ticks by PCR • Expand and test model at other installations • Arbo-virus / West Nile Virus Surveillance • Continue to identify bird and mosquito species • Test infection rates in mosquitoes by PCR • Expand surveillance to other installations