1 / 1

Housing Affordability Index: Monthly PITI Peak vs. Current by County (Q1 2014 vs. Q1 2012)

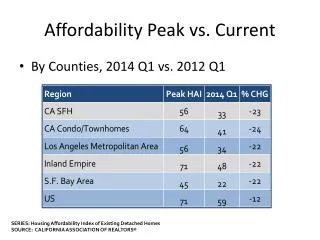
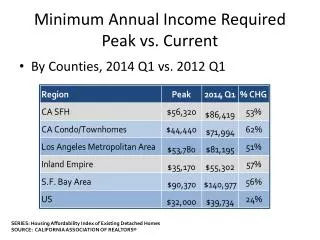
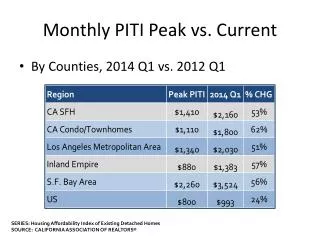
This report analyzes the Housing Affordability Index for existing detached homes in California, comparing the monthly Principal, Interest, Taxes, and Insurance (PITI) peaks of Q1 2014 to Q1 2012 across various counties. It provides insights into how housing affordability has changed over the two-year period, highlighting key variations, trends, and implications for potential homebuyers and real estate investors in California.

york
Télécharger la présentation

Housing Affordability Index: Monthly PITI Peak vs. Current by County (Q1 2014 vs. Q1 2012)

An Image/Link below is provided (as is) to download presentation Download Policy: Content on the Website is provided to you AS IS for your information and personal use and may not be sold / licensed / shared on other websites without getting consent from its author. Content is provided to you AS IS for your information and personal use only. Download presentation by click this link. While downloading, if for some reason you are not able to download a presentation, the publisher may have deleted the file from their server. During download, if you can't get a presentation, the file might be deleted by the publisher.

E N D

Presentation Transcript


  1. Monthly PITI Peak vs. Current • By Counties, 2014 Q1 vs. 2012 Q1 SERIES: Housing Affordability Index of Existing Detached Homes SOURCE: CALIFORNIA ASSOCIATION OF REALTORS®

More Related