Exploring Newton's Second Law: Measuring Force, Mass, and Acceleration in Cart Motion
60 likes | 177 Vues
This lab experiment investigates how force, mass, and acceleration are interrelated based on Newton's second law of motion. Using a Force Sensor and an Accelerometer, students will measure the force applied to a dynamics cart as it moves. The total mass of the cart can be modified by adding weights, allowing for an analysis of how varying mass affects acceleration when different forces are applied. By plotting and comparing force vs. acceleration data, participants will gain insights into the fundamental principles governing motion and the mathematical relationship between force, mass, and acceleration.

Exploring Newton's Second Law: Measuring Force, Mass, and Acceleration in Cart Motion
E N D
Presentation Transcript
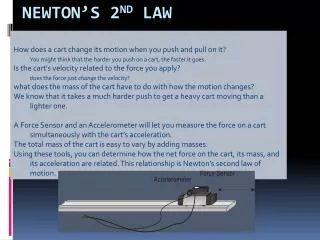
How does a cart change its motion when you push and pull on it? You might think that the harder you push on a cart, the faster it goes. Is the cart’s velocity related to the force you apply? does the force just change the velocity? what does the mass of the cart have to do with how the motion changes? We know that it takes a much harder push to get a heavy cart moving than a lighter one. A Force Sensor and an Accelerometer will let you measure the force on a cart simultaneously with the cart’s acceleration. The total mass of the cart is easy to vary by adding masses. Using these tools, you can determine how the net force on the cart, its mass, and its acceleration are related. This relationship is Newton’s second law of motion. Newton’s 2nd Law
Objectives and Materials • Materials • LabQuest • Vernier Force Sensor • LabQuest App • low-friction dynamics cart • Vernier Low-g Accelerometer • 0.50 kg mass Objectives • Collect force and acceleration data for a cart as it is moved back and forth. • Compare force vs. time and acceleration vs. time graphs. • Analyze a graph of force vs. acceleration. • Determine the relationship between force, mass, and acceleration.
Procedure - setup • Attachthe Force Sensor to a dynamics cart so you can apply a horizontal force to the hook, directed along the sensitive axis of your particular Force Sensor. • Next, attach the Accelerometer so the arrow is horizontal and parallel to the direction that the cart will roll. • Orient the arrow so that if you pull on the Force Sensor the cart will move in the direction of the arrow. • Find the mass of the cart with the Force Sensor and Accelerometer attached. Record the mass in the data table. • Set the range switch on the Force Sensor to 10 N. • Connect the Force Sensor and the Low-g Accelerometer to LabQuest. • Choose New from the File menu. • Next you will zero the sensors. • To do this, place the cart on a level surface. • With the cart stationary and no force applied to the Force Sensor, wait for the acceleration and force readings to stabilize. • From the Sensors menu choose Zero ► All Sensors. The readings for both sensors should be close to zero.
Trial I collect force and acceleration data • Grasp the Force Sensor hook. Start data collection and take several seconds to gently move the cart back and forth on the table. Vary the motion so that both small and moderate forces are applied. Make sure that your hand is only touching the hook on the Force Sensor and not the Force Sensor itself or the cart body. • Acceleration and force data are displayed on separate graphs. Sketch the graphs in your notes. How are the graphs similar? How are they different?
Trial I comparing acceleration and force data • make a new plot of force vs. acceleration, with no time axis. • From the Graph menu Choose Show Graph ►Graph 1 to view a single graph. • From the Graph menu Choose Graph Options and deselect Point Protectors and Connect Points. • This will remove the point protectors and the line connecting the data points on the subsequent graph. • Select OK. • Change the x-axis to Acceleration and the y-axis to Force. • Sketch this graph in your notes. 7. To fit a line to the graph of force vs. acceleration, • choose Curve Fit from the Analyze menu. • Select Linear as the Fit Equation. The linear-regression statistics for these two data columns are displayed in the form: y = mx + b • where x is acceleration, y is force, m is the slope, and b is the y-intercept. What does the value of the slope represent? • Select OK. • Print or sketch your graph. 8. Using the regression equation, determine the acceleration of the cart when a force of 1.0 N has acted upon it. Record the force and acceleration in the data table. 9. Repeat Step 8 using a force of –1.0 N
Trial 2 • Attach the 0.50 kg mass to the cart. Record the mass of the cart, sensors, and additional mass in the data table. • Repeat Steps 4–9 for the cart with the additional 0.50 kg mass.