Download
1 / 53
530 likes | 682 Vues
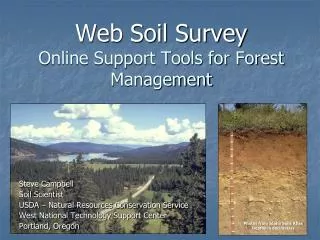
Web Soil Survey Online Support Tools for Forest Management. Steve Campbell Soil Scientist USDA – Natural Resources Conservation Service West National Technology Support Center Portland, Oregon. Photos from Idaho Soils Atlas Depths in decimeters. websoilsurvey.nrcs.usda.gov.

E N D
Web Soil SurveyOnline Support Tools for Forest Management Steve Campbell Soil Scientist USDA – Natural Resources Conservation Service West National Technology Support Center Portland, Oregon Photos from Idaho Soils Atlas Depths in decimeters
The first step is to create your Area of Interest (AOI). Current selection criteria include Address; County; Soil Survey Area; Lat/Long; Section, Township and Range; Federal Land category, and Hydrologic Unit.
You can also import a shapefile or zipped shapefile to create an Area of Interest (AOI) The AOI maximum size is 100,000 acres.
In this example PLSSis the navigation choice. Select the State. Enter Section, Township, Range. Click on the Viewbutton to zoom to this section. A
We’re now zoomed in to Section 32, Township 35 north, Range 5 east in Clearwater County, Idaho
Clicking on the question mark brings up instructions for the map tools.
The scale can be calibrated for any monitor resolution by adjusting the length of a line segment to 1 inch. Click on the Scalebutton.
When you zoom in, the aerial photo, roads, and water features appear. Layers can be turned on and off by clicking on the Legendtab.
Background can be changed from Aerial Photography to Topographic Map in the Legend.
In this example, we want to include Sections 32 and 33 in our Area of Interest. We’ll use the Zoom Out tool to make these sections visible.
The AOIbuttons are used to create your Area of Interest. The left button creates a rectangle. The right button creates a polygon of any shape. The user creates the shape by left clicking at each vertex. Left double click at the last vertex to create the Area of Interest.
After you draw your Area of Interest,it will appear as a blue hatched area.
After you’ve created your Area of Interest, it can exported to a zipped shapefile.
Clicking on the Link option displays a hyperlink for your Area of Interest that can be saved for future use or sent to others.
After the AOIis created, the size of the area and the type of data that is available is displayed. The next step is to click on the Soil Map tab. A
Soil Map with Legend of Map Units, Acres, and Percent of Area
The Map Unit Name contains a hot link to a map unit description. Click on the link to display the description.
The soil map can be saved or printed. Clicking the Printable Version button creates a PDF file with the soil map, legend, and acres of map units in the area of interest.
Click on the Soil Data Explorer tab to create maps and reports of soil properties, interpretations, and ecological site information.
The Soil Data Explorer tab provides multiple options for displaying soils and ecological site information. The Suitabilities and Limitations for Usetab is used to create maps and reports of a single interpretation such as Log Landing Suitability.
The Soil Data Explorer tab provides multiple options for displaying soils and ecological site information. The Soil Properties and Qualitiestab is used to create maps and reports for a single soil property such as Percent Clay in the surface horizon.
The Soil Data Explorer tab provides multiple options for displaying soils and ecological site information. The Ecological Site Assessmenttab is used to view and print sections of Ecological Site Descriptions.
The Soil Data Explorer tab provides multiple options for displaying soils and ecological site information. The Soil Reportstab is used to view and print reports that contain multiple soil properties and interpretations.
There are Search options for soil properties and interpretations. In this example, we’re looking for forest site index information. Click on the link for Site Index. A
The Weighted Average aggregation method is useful for soil map units that contain multiple soils such as Bouldercreek-Judgetown complex, 35 to 75 percent slopes. Click on the View Ratings button. A
Douglas-fir site index map using the weighted average aggregation method
Another option is to click on the Add to Shopping Cart button to add the site index map and report to the Shopping Cart. All maps and reports created during the session can then be downloaded as a single PDF file. Click on the Printable Version button to create a PDF file with the site index map and report. A
This report contains all the forest productivity data for the Area of Interest. Click the View Soil Report button. A
Depth to a Selected Soil Restrictive Layer Click on View Description to get more information about this soil property. Click on View Rating to generate a map and report. Choice list for Aggregation Method 2A
Dominant Component vs. Dominant Condition Aggregation Method • Example Soil Map Unit: • Alpha-Beta-Gamma complex, 5 to 20 percent slopes Dominant Component: Depth to bedrock = 35 cm (40%) Dominant Condition: Depth to bedrock = 75 cm (35 + 25 = 60%)
The Land Managementcategory contains numerous soil interpretations related to forest management.
We’ll create a map and report of a soil interpretation. Click on the Suitabilities and Limitations for Use tab. Select the Land Management category for forest management interpretations 2A
We’ll create a map and report for Construction Limitations for Haul Roads and Log Landingsinterpretation. Click on View Description to get more information about this soil interpretation. Click on View Rating to generate a map and report. There are some different aggregation choices for interpretations. We can now choose Most Limitingor Least Limiting. 2A
Map: Construction Limitations for Haul Roads and Log Landings – Dominant Condition
Report: Construction Limitations for Haul Roads and Log Landings – Dominant Condition
Description: Construction Limitations for Haul Roads and Log Landings
Soil survey data for your Area of Interest (AOI) or the entire soil survey area can be downloaded to use in a Geographic Information System (GIS). Click on the Download Soils Data tab. Then click on the Create Download Link button. 2A
Option for downloading tabular and spatial data for an entire soil survey area. Click on the Download Link. A
Data downloaded from Web Soil Survey can be used with theSoil Data Viewer ArcGIS Tool http://soils.usda.gov/sdv/
Area of Interest and Soil Map downloaded from Web Soil Survey and brought into ArcMap