Analysis of T Cell Subpopulations and Activation Markers in Immune Response
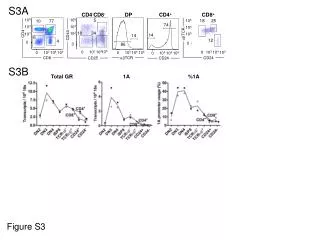
This study investigates the phenotypic and functional characteristics of various T cell subpopulations, focusing on distinct markers such as CD4, CD8, CD25, CD44, and CD24. Using a combination of flow cytometry and functional assays, we analyze the presence of αβTCR+ T cells, CD4+ and CD8+ T cell subsets, and their activation states in response to different stimuli. The data presented in Figure S3 illustrates the distribution and activation levels of these markers, providing insight into their roles in immune regulation and potential therapeutic implications.

Analysis of T Cell Subpopulations and Activation Markers in Immune Response
E N D
Presentation Transcript
CD4 10 77 CD8 6 4 CD44 CD25 CD24 TCR S3A CD4-CD8- DP CD4+ CD8+ 5 105 105 18 25 74 104 104 18 34 103 103 TCR 14 14 12 0 0 86 0 103 104 105 0 103 104 105 0 103 104 105 CD24 105 S3B 104 Total GR 1A %1A 103 0 0 0 103 103 104 104 105 105 Figure S3