Enhance STEM Learning with Pizza Sales Spreadsheet Activities
110 likes | 230 Vues
This resource offers engaging spreadsheet activities designed to connect math and technology in the classroom. Students will learn to use templates while exploring pizza sales data to answer various questions like total revenue and quantity of each pizza type ordered. With clear directions provided, students can work independently while honing their spreadsheet skills. Additional activities involve calculating area through geometry applications and experimenting with reaction time data analysis. Encourage collaborative learning and problem-solving with these STEM-focused lessons.

Enhance STEM Learning with Pizza Sales Spreadsheet Activities
E N D
Presentation Transcript
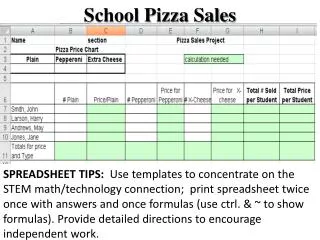
School Pizza Sales SPREADSHEET TIPS: Use templates to concentrate on the STEM math/technology connection; print spreadsheet twice once with answers and once formulas (use ctrl. & ~ to show formulas). Provide detailed directions to encourage independent work.
Evaluate Pizza Sales Data Use the pizza spreadsheet to answer these questions. 1. The student who brings in the most money gets a prize. In what cell on your spreadsheet would the answer appear? How did the computer get the answer? 2. How many pizzas of each type did the school need to order from the pizza company? In what cell on your spreadsheet will the answer appear? How did the computer get the answer? 3. How much money did the school collect for each type of pizza? Plain _____ Pepperoni _______ Extra Cheese _______ In what cell on your spreadsheet would the answers appear? How did the computer get the answer?
Clearly written directions are the key to any successful project. STEM connection: Engineering, Science, Technology, Math All areas of STEM require reading directions carefully, as well as creating direction for others to use
Math Spreadsheet – Finding Area Use Area formulas to solve for the missing dimension. RECTANGLE 1) Length = 5 cm,Width = 13.2 cm, Area = ? SQUARE 5) Side = 2.9 Area=? Read the word problems below. Sketch a model, label, and use formulas to solve. 17. Find the area of the canvas used to make a sailboat sail, the shape of a triangle, if the sail measures 12 feet along the bottom ( base) and is 21 feet tall (height). • 21. The 2 bases of a trapezoid are 20’ and 35’ and a height of 15.5. Find the area? STEM Connection: Math, Technology, Engineering
Mini Lessons – Classroom Starters (Pencil & paper activity to review math/computer skills)
Genetic Trait Data Collected from StudentsHuman Genetics: What is your Phenotype? STEM connection: Math, Science, Technology Decision-making, cooperative learning, problem solving, creativity
Using Database Filter Functions in Excel STEM connection: Technology, science, math Problem solving, cooperative learning, following directions
Genetics Spreadsheet Activity Note: I frequently build worksheets in Excel. They can be printed or use in Excel as a template
Test Your Reaction TimeWeb sites with reaction time activities • http://faculty.washington.edu/chudler/chgames.html • http://hypertextbook.com/facts/2006/reactiontime.shtml • http://www.associatedcontent.com/article/998750/simple_experiment_for_students_to_test.html?cat=9 • http://getyourwebsitehere.com/jswb/rttest01.html • http://www.open2.net/labrats/downloads/g-force.doc • http://www.stat.sfu.ca/~weldon/270-070316-reaction.pdf (Stem connection: Technology, math, science, data-analysis, cooperative learning, scientific observation, following directions)
How Do Other Factors Affect Reaction Time? • Test reaction talking & no talking; • Calculate statistics and make graphs plotting boys vs. girls. • Add data to data table that could affect/or be affected by reaction time. • Create more problem questions & filter by criteria. • Use multi-year data to compare small & large samples.