Download
1 / 66
670 likes | 781 Vues
Learn how oxygen isotopes can indicate air temperature changes through historical ice core data, unveiling the relationship between isotopes and temperature variations. Understand the isotopic composition and its implications on climate change research. Dive into the methods of dating ice cores for accurate climate reconstructions.

E N D
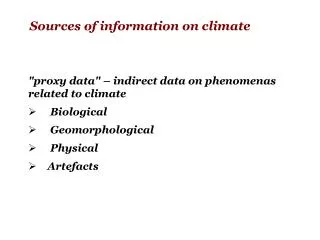
Sources of information on climate • "proxy data" – indirect data on phenomenas related to climate • Biological • Geomorphological • Physical • Artefacts
Isotopes Atomic nucleus occupies only tiny part of the whole atom. Nucleus consists on nucleons: protons – with a positive electric charge, and neutrons – electrically neutral. The electric charges of proton and electron are equall. The mass of nucleons is about 2000 times bigger than mass of electron, the mass of proton is slightly bigger than the mass of proton (neutron = proton + electron) Atoms with the same number of protons, but differ with the number of neutrons are called isotopes Atomic number of element represents the number of protons in its nucleus. Mass number of element represents the number of nucleons (protons and neutrons) in its nucleus. Mass number Element symbol Atomic number
Isotope measurements Some elements can have several stable isotopes – different types of atoms with different numbers of neutrons. (Number of protons in the nucleus define the element, number of neutrons define the isotope). The more neutrons in the nuclues the haviers the atmos. There are three stable isotopes of hydrogen, they are called: hydrogen(H), deuterium (D) i tritium (T). Here are also two stable isotopes of oxygen:
The particle of water consists of two atoms of hydrogen and one atom of oxygen. In relation of their isotopes three different water particles can be found: H218O, H216O and HD16O Standard Mean Ocean Water (SMOW) consists in 99,76% of H216O, in 0,2% of H218O and in 0,03% of HD16O.
The snow falling of Greenland glaciers has 18O in the range 23 -38‰. The snow falling of Antarctic glaciers has 18O in the range -18 -60‰. In the case of HDO:
Ratio 18O/16O Isotope 16O is lighter and evaporates faster than 18O. In normal conditions it returns to ocean together with precipitation. In glacial times 16O is trapped in the ice and a relative increase of 18O is observed in oceans. In warm periods, ice melts and the percentage of 16O increases.
How can we use oxygen isotopes to tell air temperature in the distant past? In high latitude climates the 18O concentration in precipitation varies linearly with mean annual temperature. Assuming this relationship holds for the distant past, the 18O record in ice cores can therefore beused as a proxy for mean annual temperature at the time of precipitation of the snow on the glacier.
During evaporation, the vapor, and hence clouds and precipitation, are poorer in 18Owater than the rest of the water left behind. Precipitation preferentially removes more 18O, so laterprecipitation is still poorer in 18O. The tops of icecaps, which are cold and at high elevation, receivethe most 18O-poor water as precipitation. 18O in ice therefore records air temperature. In contrast, the oceans accumulate excess 18O as 18O-poor water is transferred tothe ice sheets. The more ice, the richer the water becomes in 18O. Foraminifera and otherorganisms growing from the water also become richer in 18O, so their skeletons in ocean sedimentrecord the 18O concentration in sea water and so, indirectly, record ice volume. Ice and ocean sediment records are therefore complementary, each supplyingdifferent information about ice and ice formation.
Volcanic eruptions leave dust and acids on the surface of glaciers. High winds over dry land blowdust onto glaciers. High winds over open ocean water produces lots of sea salt spray that can alsobecome incorporated into glacial ice. The snow and ice itself contain oxygen and hydrogen isotopes, and bubbles of trapped air. All these can be analyzed to get an idea of what is going on around the mass of glacial ice.
What we know about greenhouse gasesClimatic records in ice cores • History of Earthclimatecan be reconstructed on thebasis of analysis of icecores on Greenland and Anctarctic. • Temperatures frommeasurements of oxygenisotopes. • Greenhousegasesin air bubblestrappedinicecores.
Lomonosovfonna drilled in April 1997 121 m deep, about 800 yrs Project participants: Norway, The Netherlands, Sweden, Finland, Estonia Svalbard drill sites Austfonna drilled in 1998 and 1999 289 m deep, about 800 yrs Project participants: Japan, Norway Ice cores and climateElisabeth IsakssonDmitry Divine Holtedahlfonna (Snøfjellafonna) drilled in April 2005 125 m deep, about 400 yrs Project participants: Norway, The Netherlands, Sweden, Finland, Estonia
Methods of Dating Ice Cores • Stratigraphy • Annual layers • Ratio of 18O /16O • Electrical conductivity methods • Using volcanic eruptions as Markers • Marker: volcanic ash and chemicals washed out of the atmosphere by precipitation • use recorded volcanic eruptions to calibrate age of the ice-core • must know date of the eruption
Using specific events for dating ice coresExamples from Svalbard ice cores Volcanic eruptions Nuclear weapon tests Ice cores and climateElisabeth IsakssonDmitry Divine Laki 1783 Kekonen and others, 2002 Pinglot and others, 2003
Depth –age relationship Ice cores and climateElisabeth IsakssonDmitry Divine Ice cores have layer thinning due to pure shear which means that if sample size is consistant the number per time unit will decrease with depth
CO2concentration andtemperature 370 320 31 30 SST (°C) Tropical Pacific CO2 (ppm) Antarctica 270 29 28 220 27 26 170 25 600000 400000 200000 0 czas (lata BP)
Sea level during last 450 000 years 31 20 0 30 -20 29 -40 Sea Level (m) 28 SST (°C) Tropical Pacific -60 27 -80 26 -100 -120 25 450 400 350 300 250 200 150 100 50 0 time (thousandyearsBP)
Water isotopes in deep-sea cores deep-sea foraminifera growing glaciers The “Ice Volume” effect- Light isotope removed from ocean, locked intolarge ice sheets. Ocean d18O shift (+1.5‰) recordedin marine carbonates that grew during glacial. shadow.eas.gatech.edu/~kcobb/isochem/lectures/lecture8.ppt SPECMAP – standard benthic d18O record, used to date marine sediments of unknown age
Coral records of paleo-precipitation Theory: 1)more rain = lighter d18O “amount” effect 2) surface seawater d18O will become lighter 3) coral d18O lighter shadow.eas.gatech.edu/~kcobb/isochem/lectures/lecture8.ppt Cole and Fairbanks, 1990
Water isotopes in speleothems (cave stalagmites) Theory: 1)δ18O of speleothem = δ18O of precipitation 2) δ8O of precipitation function of temperature (mid- to high-latitudes) and/or amount of rainfall (low latitudes) shadow.eas.gatech.edu/~kcobb/isochem/lectures/lecture8.ppt Wang et al., Science , 2001
After: Reconstructing & simulating past climate variability., J.F. Gonzales Rouco
After: Reconstructing & simulating past climate variability., J.F. Gonzales Rouco
Dane historyczne • zapiski dotyczące zbiorów, ceny zbóż • daty zakwitania (np. wiśni w Japonii znane od ponad 1000 lat) • warunki żeglugi (góry lodowe wokół Islandii) • daty zamarzania jezior (Japonia) • zapiski dotyczące pogody w starych kronikach kościelnych (kalendarzach) • malarstwo jaskiniowe • cechy charakterystyczne budowli • opisy pogody
ceny zbóż C. Pfister, R. Brazdil (2006)
Na ścianie tego domu w Wertheim, w Niemczech istnieją ślady 24 zdarzeń wysokiej wody spowodowanej powodziami na Tauber i Renie Pfister