Download
1 / 15
160 likes | 226 Vues
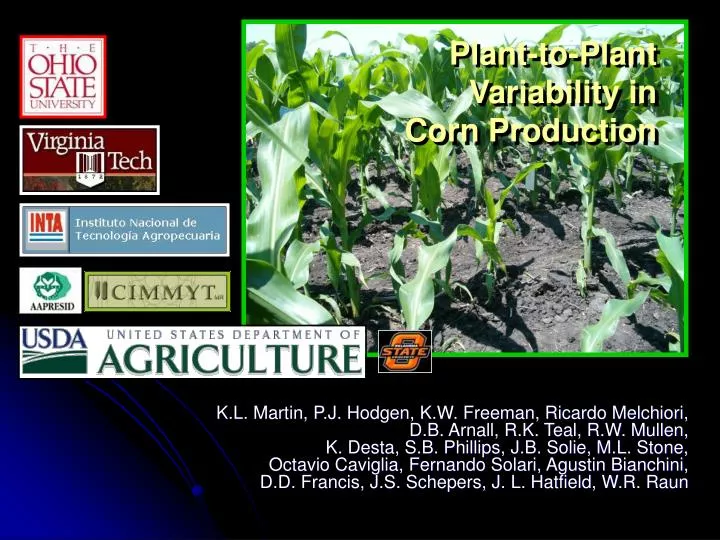
Plant-to-Plant Variability in Corn Production.

E N D
Plant-to-Plant Variability in Corn Production K.L. Martin, P.J. Hodgen, K.W. Freeman, Ricardo Melchiori, D.B. Arnall, R.K. Teal, R.W. Mullen, K. Desta, S.B. Phillips, J.B. Solie, M.L. Stone, Octavio Caviglia, Fernando Solari, Agustin Bianchini, D.D. Francis, J.S. Schepers, J. L. Hatfield, W.R. Raun
Objectives1. Evaluate by-plant corn grain yield variability over a range of production environments2. Determine the relationships among mean grain yield, standard deviation of yield, coefficient of variation of yield, and yield range3. Evaluate the relationship between NDVI and corn grain yields.
Variability in by-plant corn grain yields Delayed and uneven emergence • variable depth of planting • double seed drops • wheel compaction • location of the seed within the furrow • surface crusting • random soil clods • soil texture differences • variable distance between seeds • variable soil compaction around the seed • insect damage • moisture availability • variable surface residue • variable seed furrow closure Ames, Iowa
2003 Corn DataFAO and National Corn Growers Association Corn Grain Production Avg. Yld Area Mg/ha million haWorld 4.5 142 USA 8.9 28Argentina 6.4 2.3Mexico 2.5 7.8Iowa 9.8 4.8 Nebraska 9.2 3.1Ohio 8.7 1.2Virginia 7.2 0.2Oklahoma 7.8 0.1
Methods • By-plant Corn Grain YieldsArgentina Mexico Iowa Nebraska Ohio Virginia Oklahoma • Data collected: Grain yield, yield range, standard deviation and coefficient of variation. • Transects: corn rows ranging from 8 to 30 m in length • Individual plants marked at most sites at or before V8 to ensure detection of barren, and/or lost plants at harvest (60-85 days later depending on the maturity) • At the time plants were tagged, a tape measure was extended the length of the row and cumulative distances were recorded for each plant
Methods • At most sites (based on row spacing) the area occupied by each plant was calculated. • Each plant determined to occupy half the distance to and from its nearest neighbor • Where: • Ai is the area occupied by the ith plant • Di-1,di,di+1 are the distances to the i-1, i, and i+1 plants • R is the row spacing • Ears harvested individually, dried, and weighed • > one ear per plant , total weight was recorded on a by-plant basis • Sites where actual distances between plants were not recorded: Avg. distance occupied per plant was determined based on row spacing and total transect or row distance and number of plants harvested per row.
Mean Yield vs Std. Dev. Average corn grain yield plotted against the standard deviation from by-plant yield over 46 transects in Argentina, Mexico, Iowa, Nebraska, Ohio, Virginia, and Oklahoma.
Mean Yield vs. CV Average corn grain yield plotted against the coefficient of variation from by-plant yields over 46 transects in Argentina, Mexico, Iowa, Nebraska, Ohio, Virginia, and Oklahoma.
Mean Yield vs. Yield Range Average corn grain yield plotted against the by-plant yield range (maximum minus minimum yield) in 46 transects ranging from 10.5 to 30m in length, in Argentina, Mexico, Iowa, Nebraska, Ohio, Virginia, and Oklahoma.
Distance Averaged vs. Error Effect of averaging plant yields over a specified distance along the row on the absolute error incurred when using the average corn yield for estimating the by-plant yield. Yields were normalized by the average yield along the entire row.
MeasuredDistances Average corn grain yields plotted by plant, every 2 plants, every 3 plants and every 4 plants, using measured distances between plants, Ames, IA 2004.
Fixed Distances Average corn grain yields computed using fixed distances of 23.5, 47.0, 70.6, and 94.1 cm at Ames, IA 2004
NDVI vs Yield NDVI versus corn grain yield determined for every 4 plants using linear regression and associated 95% confidence intervals, east row, Ames IA, 2004. +/- 1000 kg/ha
Location Statistics Minimum, maximum, mean, standard deviation, maximum/minimum and CV for by-plant corn grain yields from 46 transects in Argentina, Mexico, Iowa, Nebraska, Ohio, Virginia, and Oklahoma, 2002-2004. ________________________________________________________________________________________________________Location Years Transects Min Yield Max Yield Mean Yield Stdev Max/Min CV ------------------------ kg ha-1----------------------- % El Batan, Mexico 2002 3 606 9440 4268 1935 22.4 45.3 OK, <6000 kg ha-1 2003-4 12 1128 9169 4652 1724 10.0 37.2 OK, >6000 kg ha-1 2003-4 8 1947 14120 7050 2167 11.6 30.5 Ames, IA, Shelton, NE 2004 4 1872 21173 8320 3660 14.1 46.0 Wooster, OH 2004 1 2066 19458 9759 4367 9.4 50.2 Parana, Argentina 2003 9 2806 28058 11478 4211 15.0 36.8 Painter, VA 2003 4 4753 24552 11943 3171 5.2 26.7 Phillips, NE 2004 5 7098 21492 14383 2926 3.2 20.3 -------------------------------------------------------------------------------------------------------------- All Sites 2002-04 46 2752 17281 8495 2765 11.1 34.3 ________________________________________________________________________________________________________ 44 bu/ac
Summary • Errors associated with predicting yield at V8 were dwarfed in comparison to the recorded by-plant yield differences • Can N management at this scale help since yield potential can be predicted. • By-plant nutrient management could be eliminated by developing production systems that homogenized plant stands, and emergence • Over all sites, plant-to-plant variation in corn grain yield averaged 2765 kg/ha (44.1 bu/ac). Sites with the highest average corn grain yield (11478 and 14383 kg/ha, Parana Argentina, and Phillips, NE), had plant-to-plant variation in yields of 4211 kg/ha (67 bu/ac) and 2926 kg/ha (47 bu/ac)