Download
1 / 20
200 likes | 406 Vues
Total abundance ( N ) number of individuals Species richness ( S ) number of species. S ≤ N. Rank-abundance distribution (RAD). Abundance. Rank in abundance. Rank-abundance distribution (RAD). Abundance. Rank in abundance. n 1 + n 2 +…+ n S = N. Abundance. Rank in abundance.

E N D
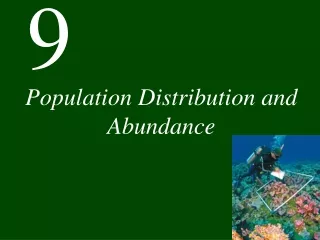
Total abundance (N)number of individualsSpecies richness (S) number of species S ≤ N
Rank-abundance distribution (RAD) Abundance Rank in abundance
Rank-abundance distribution (RAD) Abundance Rank in abundance
n1+n2+…+nS = N Abundance Rank in abundance
N=50, S=10 16,958 forms of the RAD Abundance Rank in abundance
The feasible set(all possible shapes of the RAD) 16,958 shapes for Q = 50 & N = 10 Abundance Rank in abundance
Mapping the feasible set N=1,000 S=80 ln(abundance) Rank in abundance
The center of the feasible set N=500 S=50 ln(abundance) Rank in abundance
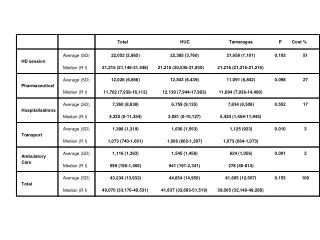
102 101 100 R2 = 0.93 Observed abundance 100 101 102 Abundance at center of the feasible set
0.84 0.85 0.74 Observed abundance 0.78 0.80 0.76 Abundance at center of the feasible set
Total (N)number of individual ‘things’Entities (S)number of groups of ‘things’ S ≤ N
0.93 0.88 0.91 0.91 Observed home runs 0.94 0.93 Expected home runs http://mlb.mlb.com
Urban population sizes among nations (1960-2009, rescaled) Oil related CO2 emission among nations (1980-2009, rescaled) 0.91 0.92 Observed Observed Expected Expected
Total (N)number of individual ‘things’Entities (S)number of groups of ‘things’ S ≤ N
Species evenness for all possible RADs N = 50, S = 20 density N = 50, S = 10 Species evenness (Evar)
Species evenness for all possible RADs N = 50, S = 20 density N = 50, S = 10 Species evenness (Evar)
Percentile of feasible set Evenness
ln(abundance) Normalized rank
Acknowledgements For collecting, managing and providing datasets: North American Breeding Bird Survey Christmas Bird Count Gentry’s Forest Transect Data Forest Inventory and Analysis dataset Microbial metagenomic datasets accessed from MG-RAST Mammal Community Database Awesome folks: X. Xiao, D. McGlinn, J. Kitzes, James O’Dwyer Funding: CAREER grant from the U.S. National Science Foundation to EPW (DEB-0953694) Research grant from Amazon Web Services Other Support: Utah State University’s Department of Biology and the Ecology Center