NGS Bioinformatics Workshop 1.3 Sequence Alignment and Searching
920 likes | 1.21k Vues
NGS Bioinformatics Workshop 1.3 Sequence Alignment and Searching. March 21 st , 2012 IRMACS 10900 Facilitator: Richard Bruskiewich Adjunct Professor, MBB. Deeply Grateful Acknowledgment: Again, this week’s slides mainly courtesy of Professor Fiona Brinkman, MBB. Objectives.

NGS Bioinformatics Workshop 1.3 Sequence Alignment and Searching
E N D
Presentation Transcript
NGS Bioinformatics Workshop1.3 Sequence Alignment and Searching March 21st, 2012 IRMACS 10900 Facilitator: Richard Bruskiewich Adjunct Professor, MBB Deeply Grateful Acknowledgment: Again, this week’s slides mainly courtesy of Professor Fiona Brinkman, MBB
Objectives • Be aware of the importance of sequence searching and sequence alignment • Appreciate the difference between sequence "similarity" and "homology" • Be familiar with some common algorithms and scoring schemes used in sequence alignment and sequence searching • Understand the benefits and pitfalls of the different methods presented
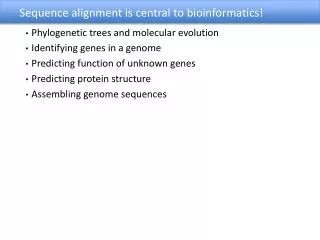
“It’s a Fact” Sequence comparisons, which are based on evolutionary theory, are the foundation of bioinformatics
Alignments tell us about... • Function or activity of a new gene/protein • Structure or shape of a new protein • Location or preferred location of a protein • Stability of a gene or protein • Origin of a gene, protein, organelle, organism…
Similarity refers to the likeness or % similarity between 2 sequences Similarity of sequences usually means sharing a statistically measured number of bases or amino acids Similarity does not necessarily imply homology Homology refers to shared ancestry Two sequences are homologous if they are derived from a common ancestral sequence Homology often implies similarity(note that structural, but not sequence, similarity may occur) Similarity versus Homology
Similarity by chance – the impact of sequence complexity MCDEFGHIKLAN…. High Complexity ACTGTCACTGAT…. Mid Complexity NNNNTTTTTNNN…. Low Complexity Low complexity sequences are more likely to appear similar by chance Can you think of examples of low complexity sequences that in Nature? Perhaps encoding certain structural features?
Similarity that likely does not reflect homology, but rather homoplasy (i.e. it has been observed to evolve multiple independent times) • Examples of low complexity sequences: • Hydrophobic transmembrane alpha-helical sequences in membrane proteins • CAG repeats in genes causing huntington disease, spinal and bulbar muscular atrophy, dentatorubropallidoluysian atrophy • Proline-rich regions in proteins • Poly-A tails in nucleotide sequence
Example of homology but little sequencesimilarity: The N-terminal domain of OprF and OmpA share only 15% identity but are homologous OprF 1 -QGQNSVEIEAFGKRYFTDSVRNMKN-------ADLYGGSIGYFLTDDVELALSYGEYH OmpA 1 APKDNTWYTGAKLGWSQYHDTGLINNNGPTHENKLGAGAFGGYQVNPYVGFEMGYDWLG * * * * ** * * OprF 52 DVRGTYETGNKKVHGNLTSLDAIYHFGTPGVGLRPYVSAGLA-HQNITNINSDSQGRQQ OmpA 60 RMPYKGSVENGAYKAQGVQLTAKLGYPIT-DDLDIYTRLGGMVWRADTYSNVYGKNHDT * * * * * * * * OprF 110 MTMANIGAGLKYYFTENFFAKASLDGQYGLEKRDNGHQG--EWMAGLGVGFNFG OmpA 118 GVSPVFAGGVEYAITPEIATRLEYQWTNNIGDAHTIGTRPDNGMLSLGVSYRFG * * * * *** **
OprF model (yellow and green) aligned with the crystal structure of OmpA (blue) – for the N-terminal domain Many residues are in the same three dimentional environment, though on different strands
OprF and OmpA similarity OprF 1 -QGQNSVEIEAFGKRYFTDSVRNMKN-------ADLYGGSIGYFLTDDVELALSYGEYH OmpA 1 APKDNTWYTGAKLGWSQYHDTGLINNNGPTHENKLGAGAFGGYQVNPYVGFEMGYDWLG * * * * ** * * OprF 52 DVRGTYETGNKKVHGNLTSLDAIYHFGTPGVGLRPYVSAGLA-HQNITNINSDSQGRQQ OmpA 60 RMPYKGSVENGAYKAQGVQLTAKLGYPIT-DDLDIYTRLGGMVWRADTYSNVYGKNHDT * * * * * * * * OprF 110 MTMANIGAGLKYYFTENFFAKASLDGQYGLEKRDNGHQG--EWMAGLGVGFNFG OmpA 118 GVSPVFAGGVEYAITPEIATRLEYQWTNNIGDAHTIGTRPDNGMLSLGVSYRFG * * * * *** **
Similarity versus Homology • Similarity can be quantified • It is correct to say that two sequences are X% identical • It is correct to say that two sequences have a similarity score of Z • It is correct to say that two sequences are X% similar, as long as the criteria for similarity is clear.
Similarity – specifying criteria • % similarity, with the following criteria:I=L=V; R=K • % similarity according to BLAST
Similarity versus Homology • Homology cannot be quantified “Its homologous or it isn’t” • If two sequences have a high % identity it is OK to say they are homologous • It is incorrect to say two sequences have a homology score of Z • It is incorrect to say two sequences are X% homologous or have a homology of X %
Rbn KETAAAKFERQHMD Lsz KVFGRCELAAAMKRHGLDNYRGYSLGNWVCAAKFESNFNT Rbn SST SAASSSNYCNQMMKSRNLTKDRCKPMNTFVHESLA Lsz QATNRNTDGSTDYGILQINSRWWCNDGRTP GSRN Rbn DVQAVCSQKNVACKNGQTNCYQSYSTMSITDCRETGSSKY Lsz LCNIPCSALLSSDITASVNC AKKIVSDGDGMNAWVAWR Rbn PNACYKTTQANKHIIVACEGNPYVPHFDASV Lsz NRCKGTDVQA WIRGCRL Assessing Sequence Similarity is this alignment significant?
Some Simple (but not Hardfast)Guiding Rules After low complexity sequences are considered… • If two sequence are > 200 residues and > 25% identical, they are likely related • If two sequences are 15-25% identical they may be related, but more tests are needed • If two sequences are < 15% identical they are most likely not related (but not always!) • If you need more than 1 gap for every 20 residues the alignment is suspicious
Doolittle’s Rules of Thumb Likely related “The Twilight Zone” Likely unrelated Russel Doolittle. Science 1981 Oct 9;214(4517):149-59
Sequence Alignment - Methods • Dot Plots • Dynamic Programming • Heuristic (Approx. but Fast) Local Alignment – FASTA and BLAST • Multiple Sequence Alignment
Dot Plots • “Invented” in 1970 by Gibbs & McIntyre • Good for quick graphical overview – any size of sequence • Simplest method for sequence comparison • Inter-sequence comparison • Intra-sequence comparison • Identifies internal repeats • Identifies domains or “modules”
Dot Plot Algorithm • Take two sequences (A & B), write sequence A out as a row (length=m) and sequence B as a column (length =n) • Create a table or “matrix” of “m” columns and “n” rows • Compare each letter of sequence A with every letter in sequence B. If there’s a match mark it with a dot, if not, leave blank
Dot Plot Algorithm Direct repeats A C D A C D G H A C D E F G H
Dot Plot Algorithm and Inverted Repeats A C D E F G H G F A C D E F G H G F
Dot Plots • The most popular freeware package is Dotter http://sonnhammer.sbc.su.se/Dotter.html • Dotlet - web-basedhttp://myhits.isb-sib.ch/cgi-bin/dotlet
G E N E T I C S G E N E T I C S G 10 0 0 0 0 0 0 0 G 60 40 30 20 20 0 10 0 E 0 10 0 10 0 0 0 0 E 40 50 30 30 20 0 10 0 N 0 0 10 0 0 0 0 0 N 30 30 40 20 20 0 10 0 E 0 0 0 10 0 0 0 0 E 20 20 20 30 20 10 10 0 S 0 0 0 0 0 0 0 10 S 20 20 20 20 20 0 10 10 I 0 0 0 0 0 10 0 0 I 10 10 10 10 10 20 10 0 S 0 0 0 0 0 0 0 10 S 0 0 0 0 0 0 0 10 Dynamic Programming
Dynamic Programming • Developed by Needleman & Wunsch (1970) • Refined by Smith & Waterman (1981)(improvements by Gotoh, Altschul & Erickson, Pearson…) • Ideal for quantitative assessment • Guaranteed to be mathematically optimal • Slow N2 algorithm • Performed in 2 stages • Prepare a scoring matrix using recursive function • Scan matrix diagonally using traceback protocol
The Recursive Function(ACK!) Si-1,j-1or max Si-x,j-1 + wx-1or max Si-1,j-y + wy-1 Sij = sij + max 2<x<i 2<y<i W = gap penalty S = alignment score Note: This is a classic, simple Smith-Waterman implementation. For dynamic programming you will also see other implementations on the web such as Needleman & Wunsch and more advanced implementations of Smith-Waterman
X X X X X X - - - - - X - - - - - X --- - - X - - - ? - Sij = sij + max Si-1,j-1or max Si-x,j-1 + wx-1or max Si-1,j-y + wy-1 An Example... What is the Matrix? W = gap penalty S = alignment score 2<x<i 2<y<i A A T V D A 1 V V D A A T V D A 1 1 V V D A A T V D A 1 1 0 0 0 V V D A A T V D A 1 1 0 0 0 V 0 V D A A T V D A 1 1 0 0 0 V 0 1 1 V D A A T V D A 1 1 0 0 0 V 0 1 1 2 1 V D
An Example...Filling in the Matrix… Traceback through the Matrix… A A T V D A 1 1 0 0 0 V 0 1 1 2 1 V D A A T V D A 1 1 0 0 0 V 0 1 1 2 1 V 0 1 1 2 2 D 0 1 1 1 3 A A T V D A 1 1 0 0 0 V 0 1 1 2 1 V 0 1 1 2 2 D 0 1 1 1 3 A A T V D | | | A V - V D
Could We Do Better? • Dynamic Programming always gives the mathematically correct answer • Dynamic Programming does not always give the biologically correct answer • Key to the performance of Dynamic Programming is the scoring function – The Scoring Matrix
A R N D C Q E G H I L K M F P S T W Y V A 1 R 0 1 N 0 0 1 D 0 0 0 1 C 0 0 0 0 1 Q 0 0 0 0 0 1 E 0 0 0 0 0 0 1 G 0 0 0 0 0 0 0 1 H 0 0 0 0 0 0 0 0 1 I 0 0 0 0 0 0 0 0 0 1 L 0 0 0 0 0 0 0 0 0 0 1 K 0 0 0 0 0 0 0 0 0 0 0 1 M 0 0 0 0 0 0 0 0 0 0 0 0 1 F 0 0 0 0 0 0 0 0 0 0 0 0 0 1 P 0 0 0 0 0 0 0 0 0 0 0 0 0 0 1 S 0 0 0 0 0 0 0 0 0 0 0 0 0 0 0 1 T 0 0 0 0 0 0 0 0 0 0 0 0 0 0 0 0 1 W 0 0 0 0 0 0 0 0 0 0 0 0 0 0 0 0 0 1 Y 0 0 0 0 0 0 0 0 0 0 0 0 0 0 0 0 0 0 1 V 0 0 0 0 0 0 0 0 0 0 0 0 0 0 0 0 0 0 0 1 Identity Scoring Matrix (Sij)
Scoring Matrices • An empirical model of evolution, biology and chemistry all wrapped up in a 20 X 20 table of integers • Structurally or chemically similar residues, or residues that otherwise reflect some degree of similarity should ideally have high scores
A Better Matrix - PAM250 Dayhoff (1978) or Point-accepted-mutation 250 matrix): Counted the number of substitutions in related proteins across different species. Large scores are given to identities and substitutions which are found frequently. 1PAM is a unit of evolutionary divergence in which 1% of the amino acids have been changed. PAM 250 is an extrapolation to 250 mutations per 100 residues
Using PAM250... A T V D A 2 T 1 3 V 0 0 4 D 0 0-2 4 A mini version of the PAM 250, showing only relevant residues: Gap Penalty = -1 A A T V D A 2 V V D A A T V D A 2 1 V V D A A T V D A 2 1 0 -1 -1 V V D
Even better: BLOSUM Matricies • BLOSUM 90 - BLOcksSUbstitutionMatrix,from BLOCKS of sequences with >90% sequence ID best for short alignments with high similarity • BLOSUM 62 - prepared from BLOCKS of sequences with >62% sequence ID best for general alignment (default) • BLOSUM 30 - prepared from BLOCKS of sequences with >30% sequence ID best for detecting weak local alignments
Dynamic Programming Algorithms • Great for doing pairwise global alignments • Produces a quantitative alignment “score” • "Problems" if one tries to do alignments with very large sequences/databases (memory requirement and run time grows as N2 or as N x M) • SSEARCH is one great implementation (by Pearson) that can work, can do local alignments, and is guaranteed to find the optimal alignment, but it is sloooowww • Need an alternative for searching large databases of sequences like Genbank…..
Fast Local (and Heuristic) Alignment Methods • Developed by Lipman & Pearson (1985/88) • Refined by Altschul et al. (1990/97) • Ideal for large database comparisons • Uses heuristics & statistical simplification so not guaranteed to find all optimal sequence alignments • Fast N-type algorithm (similar to Dot Plot)
FASTA • Cuts sequences into short words (k-tuples) • Uses “Hash Tables” to speed comparison • Looks for clusters of nearby or locally dense “identical” k-tuples • init1 score = score for first set of k-tuples (using PAM250 matrix) • initn score = score for gapped k-tuples (i.e. after applying joining threshold – using a gap penalty) • opt score = optimized alignment score • Z-score = number of S.D. above random • expect = expected # of random matches
Query: ACDEFGDEF….. ACD CDE DEF EFG FGD GDE … 1 2 3,7 4 5 6 Fast Alignment Algorithm ACD CDE DEF EFG FGD GDE ACE CDD NEF … … … GCE CEE DEY … … … GCD DDY … … …
Query: ACDEFGDEF….. ACD CDE DEF EFG FGD GDE ACE CDD NEF … … … GCE CEE DEY … … … GCDDDY … … … Database: LMRGCDDYGDEY… Fast Alignment Algorithm
Fast Alignment Algorithm A C D E F G D E F... L M R G CD D Y G
Fast Alignment Algorithm FASTA continued…
FASTA Note: in the end, FASTA can produce optimized alignments (based on an initial heuristic search but then using Smith-Waterman in the end) but it is not guaranteed to find all optimal “hits”/alignments in a database vs SSEARCH. Overview of FASTA: http://en.wikipedia.org/wiki/FASTA Web-based FASTA access: http://www.ebi.ac.uk/Tools/fasta/
Let’s try an experiment... ACDEAGHNKLM... KKDEFGHPKLM... SCDEFCHLKLM... MCDEFGHNKLV... Align ACDEFGHIKLM... QCDEFGHAKLM... AQQQFGHIKLPI... WCDEFGHLKLM... SMDEFAHVKLM... ACDEFGFKKLM...
What kind of score distribution do you get? Gaussian? Poisson? Other?