Download
1 / 23
230 likes | 362 Vues
Learn to graph polynomial functions, identify turning points and zeros, determine degrees, leading coefficients, and more. Practice estimating coordinates of turning points and recognizing local maximum and minimum values.

E N D
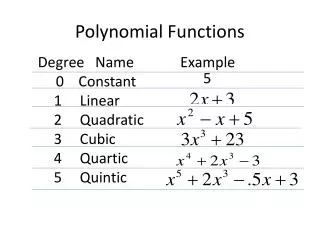
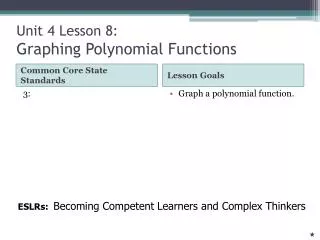
Unit 4 Lesson 8:Graphing Polynomial Functions Common Core State Standards Lesson Goals 3: • Graph a polynomial function. ESLRs: Becoming Competent Learners and Complex Thinkers
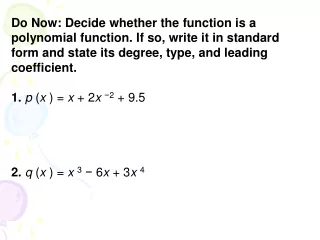
Review of Some Terms zero of a function: A number, k, is a zero of a function when x is replaced with k and the answer is zero. factor of a function: An expression, (x – k), is a factor of a function when the function is divided by (x – k), the remainder is zero. solution of a function: The number, k, that results from solving a function when the function is set equal to zero.
Review of Some Terms If the number, k, is a real number, then k is also an x-intercept for the graph of the function. y x
Graphing Polynomial Functions y Turning Points: The y-coordinate of a turning point is a local maximum if it is higher than nearby points or a local minimum if it is lower than nearby points. y is a local maximum. y is a local minimum. x A function with degree n has at most n – 1 turning points. If the function has n zeros, then the function has exactly n – 1 turning points
Determine the lowest-degree polynomial that has the given graph. A function with degree n has at most n – 1 turning points. Is the degree even or odd? Is the leading coefficient positive or negative?
Estimate the coordinates of each turning point. maximum minimum minimum Do the turning points correspond to a local minimum or a local maximum?
Determine the lowest-degree polynomial that has the given graph. A function with degree n has at most n – 1 turning points. Is the degree even or odd? Is the leading coefficient positive or negative?
Estimate the coordinates of each turning point and state whether the turning point corresponds to a local minimum or a local maximum. maximum maximum minimum minimum
Graphing Polynomial Functions y degree: leading coefficient: x
Graphing Polynomial Functions y zeros: x
Graphing Polynomial Functions degree: leading coefficient: zeros: turning points:
Graphing Polynomial Functions degree - shape leading coefficient - direction zeros – x-intercepts turning points U up no rational at most 3
y x
Today’s Assignment • p. 376: 15 – 27 l
Check Assignment • p. 376: 15 – 27 l
y Snake-shaped Rises left to right 3 real zeros 2 turning points x
y Snake-shaped Rises left to right 1 real zero At most 2 turning points x
maximum zeros minimum degree minimum
zeros maximum maximum degree minimum