Download
1 / 45
450 likes | 553 Vues
Unravel the complexities of different map projections, from cylindrical to Mercator, uncovering how distortion impacts representation. Discover the significance of accurate projections for geographic analysis and navigation. Explore the historical context and practical applications behind various map types. Learn to interpret maps effectively for diverse geographical purposes.

E N D
Unit 1: Methods of Geographic Inquiry A geographer’s basic tools!
Maps and Globes • Introductory Video • http://videos.howstuffworks.com/hsw/8402-basics-of-geography-ii-maps-and-globes-video.htm
Map Projections • Because the earth is a sphere, the only true way to represent the earth is with a ball or sphere. To fully represent the earth, geographers and scientists alike have created the globe. • Imagine yourself as a tourist in New York City. Wouldn’t it be difficult to walk around 45th Street with a globe in your back pocket? • Therefore, geographers created maps!
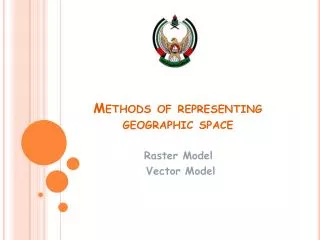
Map Projections • When features of a globe (or the earth) are transferred to a flat surface, ie: a piece of paper of computer monitor, a map projection is created. • There are several ways to transfer the 3-Dimensional shapes to a 2-Dimensional surface
Map Projections • When a map projection is created, however, there is distortion that occurs • Distortion occurs in the shape and size of the natural features • Because we are transferring the natural features to a 2D surface, we have to stretch or compress some of those natural features.
Types of Map Projections • Cylindrical Projection: A cylindrical projection map is the most common type of map that we see. Imagine placing the movie screen around the globe in a cylinder shape. The projection that results is depicted in this image. Notice that areas close to the equator have very little distortion. However, the closer to the poles that one travels, the more distorted that the map becomes. In this example, Greenland appears to be many times larger than it really is.
Types of Map Projections • Conic Projection: A conic projection map is created by placing a cone shaped screen on a globe. The resulting projection is more accurate than the cylindrical projection map discussed above. However, the further we travel down the map, the more distorted, and less accurate the map becomes.
Types of Map Projections • Plane Projection: A plane projection is created by placing an imaginary screen directly above, or below a globe. The image that would result is called a plane projection. This type of map projection is not commonly used.
Types of Map Projections • Interrupted Projection: There are many different types of interrupted projection maps. These types of maps try to depict the continents as accurately as possible by leaving blank space in the less important areas of the map, such as in the oceans.
Types of Map Projections • The most commonly used map is the Mercator Map • developed by Gerardus Mercator, a Flemish mapmaker, in 1569
Map Projection Take the oranges on the right. If we were to draw a triangle on the oranges and then peel the orange. From the peels we would then flatten them as best as possible. What would the triangle look like?
Mercator Map Projection • In the Mercator Map Projection • angles are preserved • distances away from the equator become progressively distorted. • South America (land mass) is actually nine times as big as Greenland • But how does South America compare to Greenland on the Mercator Map?
Mercator Map Projection • The Mercator projection is called Conformal. A projection is conformal if the angles in the original features are preserved. • Over small areas the shapes of objects will be preserved. • A line drawn with constant orientation (e.g. with respect to north) will be straight on a conformal projection (a thumb line). • Parallels and meridians cross each other at right angles (note: not all projections with this appearance are conformal). • Generally, areas near margins have a larger scale than areas near the center (i.e. Greenland in Mercator projection).
Mercator Map Projection • The Mercator map has always been a poor projection for a world map. • Because it was based on a rectangular grid, the average person found it easy to read and found it useful for wall maps, atlas maps, and maps in books. • It became the standard map projection in the mental map of most westerners. • The argument for using the Mercator projection was the "advantage for colonial powers" by making Europe look a lot larger than it actually is on the globe.
Mercator Map Projection Video • Lets take a look at how Mercator made his maps • http://videos.howstuffworks.com/hsw/8607-geography-basics-methods-for-making-maps-video.htm#
Maps • What is a map? • A map is a drawing or image of the earth’s surface drawn on a flat surface. • Maps use symbols and colours to represent the features of an area • A map can be hand drawn or computer drawn • http://videos.howstuffworks.com/hsw/17320-geography-basics-maps-video.htm
Creating Maps • All maps should be drawn for a purpose, such as: • to provide direction from A to B or to • provide information on a specific topic. • Specifics for topics can include: • Listing capital cities of provinces/territories • Describing the amount of rainfall in different parts of the country
Creating Maps • Great care should be taken when creating a map. • Maps should be drawn neatly and it is best to draw lightly in pencil and then to go over in ink when necessary.
Creating Maps • When placing text on maps, it is best to print the words. • When using colour, it is very important that you chose the correct colour to show different features.
Features of Maps - Colours • On Maps, the colours chosen are very important! Generally: • roads and trails are brown • parks are green • water ways (lakes and rivers) are blue • roads are usually black • highways are usually red or orange • text such as city labels are in black
Features of a Map - Elements • When creating a map, there are some features that must be included on all maps. • What do you see on the following map?
Features of a Map • Title • Provides a clear description of: • the area the map it is representing and • what information is presented (Example: Road Map of Ontario). • tell the reader what the map is used for. • The title should be short and descriptive. • Should be placed in an appropriate location (top and centre). • Should be neat and printed in dark ink.
Features of a Map • Border • All of the information and features the map is showing should be contained within the border. • Should be drawn neatly with a ruler in dark ink.
Features of a Map • North Arrow • Provides the reader a reference as per the direction on the map. • Should be drawn neatly with a ruler in dark ink within the border.
Features of a Map • Source • The author of a map is called a cartographer. • The person/people/company or organization that created the map should be provided.
Features of a Map • Date • The date when the map was produced should be displayed.
Features of a Map • Scale • The scale provides the map reader with a method of measuring distances on the map with actual distances in real life.
Features of a Map • Legend • The legend provides the map reader with an understanding of the various symbols that are used on the map. • The symbols chosen should accurately reflect the feature that is being represented.
Types of Maps • There are several types of maps. Each show different information. The type of map a reader uses depends on what information he/she is trying to gather • Generally speaking, map are categorized into three categories: • General Purpose Maps • Topographic Maps • Thematic Maps
Types of Maps 1. General Purpose • Provides many types of information on one map. • Most atlases, wall maps and road maps fall into this category. • Provides a broad understanding of the location and features of an area.
Types of Maps 2. Topographic Maps • Uses symbols to show a variety of features on the earth’s surface. • They are used to examine a small area of the earths surface in great detail. • Include contour lines to show the shape and elevation of an area. • Lines that are close together indicate steep terrain, and lines that are far apart indicate flat terrain.
Types of Maps 3. Thematic Maps • Provide very specific information about a place on one particular topic. • Because only one topic is presented, these maps are relatively easy to read and understand. • May include • Climatic, Resource, Economic or Political information.
Types of Thematic Maps • Climate maps • Give general information about the climate; temperature and precipitation (rain and snow) of a region. • Cartographers, or mapmakers, use colors to show different climate or precipitation zones • Economic maps • Cartographers use symbols to show the locations of economic activity • For example, symbols (shovels) on a map of Ontario tell you where mining occurs.
Types of Maps • Political maps • Do not show physical features. • Instead, they indicate state and national boundaries and capital and major cities. • A capital city is usually marked with a star within a circle. • Resource maps • Feature the type of natural resources or economic activity that dominates an area. • For example a map showing the different type of trees in Northern Ontario
Homework • Textbook - page 26 #1, 2,5, 6, 7, 8, 11 • Lab Assignment Sheet - handout • Due Date: Thursday, February 24, 2011