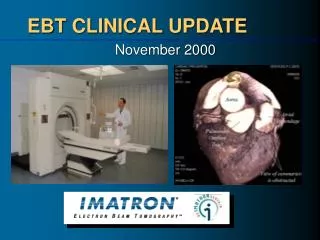
EBT CLINICAL UPDATE
EBT CLINICAL UPDATE. November 2000. EBT Clinical Applications. CARDIAC IMAGING Coronary Artery Calcium Scanning Coronary Electron Beam Angiography (EBA) Functional Cardiac Imaging BODY IMAGING Pulmonary Embolism Low-Dose Lung Scanning Abdominal Scanning Colonography

EBT CLINICAL UPDATE
E N D
Presentation Transcript
EBT CLINICAL UPDATE November 2000
EBT Clinical Applications CARDIAC IMAGING • Coronary Artery Calcium Scanning • Coronary Electron Beam Angiography (EBA) • Functional Cardiac Imaging BODY IMAGING • Pulmonary Embolism • Low-Dose Lung Scanning • Abdominal Scanning • Colonography • Peripheral EBA (Carotid, Aorta, Renal, Femoral) • Head Scan
EBT Coronary calcium scan 50 to 63 mrem 0.5 to 0.63 mSv EBT Coronary EBA scan 70 to 90 mrem 0.7 to 0.9 mSv EBT Low-dose Lung scan 100 to 150 mrem 1.0 to 1.5 mSv Background radiation in 1year 300 mrem 3.0 mSv Cross country airplane trip 2 mrem 0.02 mSv Chest X-ray 8 to 10 mrem 0.08 to 0.1 mSv Abdominal X-ray 48 mrem 4.8 mSv Lumbar Spine X-ray series 300 mrem 3.o mSv Coronary Angiogram 500 to 600 mrem 5.0 to 6.0 mSv Lower G.I. X-ray series 600 mrem 6.0 mSv EBT Radiation Dose Radiation dose from EBT scans compared to other sources of radiation Radiation Source Millirems Millisieverts The advantage of the EBT over conventional scanners is that, instead of exposing the entire circumference of the body to the X-ray beam, the EBT X-ray beam enters from the back. Thus, anterior structures such as the breast and thyroid are subjected to a lesser dose of radiation (17% of the entrance skin dose).
Functional Cardiac Imaging Multi-Slice Mode Cine and Flow Acquisitions
Cardiac Imaging Prospective ECG-Triggering Cine Mode – Functional Cardiac Imaging Flow Mode – Perfusion Imaging 80% RR1 40% RR2 Volume Mode – Coronary Imaging (Calcium & EBA)
Functional Cardiac Imaging • Myocardial Perfusion Scanning Protocol Flow Mode • Table is slewed for Long Axis • ECG Triggered to 40% of the R to R interval • MSM 8 mm 15 to 20 images per level • Injection of 35ml IV contrast @ 4ml per second. Repeat scan post stress Pre Dobutamine Stress Post Dobutamine Stress
Functional Cardiac Imaging • Ejection Fraction Scanning Protocol Cine Mode • Table is slewed for Short Axis • ECG Triggered to 0% of the R to R interval • MSM CINE mode 8 mm 15 to 20 images per level • Injection of 35ml IV contrast @ 4ml per second • Repeat scan post stress Diastole Systole Pre Dobutamine Stress Pre Dobutamine Stress Post Dobutamine Stress Post Dobutamine Stress
Coronary Artery Calcium Scanning Step Volume Mode ECG Triggered Acquisitions
Coronary Calcium Scanning • Coronary Artery Scanning Protocol • Patient Preparation: None • ECG Triggered to 60-70% of the R to R interval • 3mm contiguous scans • From carina to the apex
Calcium Report Generation • Coronary Artery Calcium Report • Agatston Calcium Score • Volume Calcium Score • Example Images • Clinical Findings • Clinical Recommendations • Further Cardiac testing
Coronary Calcium Progression Progression of Right coronary artery calcium score over 5 years 1993 1995 1997 Calcium Score: 56 Calcium Score: 90 Calcium Score: 128 Volume Score: 45 Volume Score: 78 Volume Score: 113
Coronary Calcium Scanning Visualization of Non-obstructive Plaque Formation - EBT LAD LM LAD LCX Soft Plaque G.O. Kerkhoff, Alfried Krupp Hospital Essen (2000)
Coronary EBA Step Volume Mode ECG Triggered Acquisition
Coronary EBA • CLINICAL INDICATIONS • Follow-up PTCA and Stents • Follow-up Bypass grafts • Equivocal results following stress testing (or stress imaging) • Congenital anomalies • Symptomatic patients with Coronary Calcium score • Asymptomatic patients with Coronary Calcium score greater than 400 or in the 75 percentile • Pre and post operative Heart transplant patients • People who are not willing to have an elective conventional angiogram
Coronary EBA • Coronary EBA Scanning Protocol • Patient Preparation: Start IV • ECG Triggered to 40% of the R to R interval • 3mm x 2mm scans • Injection of 150ml IV contrast @ 4ml per second • Normal algorithm, 18 cm FOV
Coronary EBA Report Generation • Coronary Artery EBA Report • Clinical Indication • Procedure • Example Images • Clinical Findings • Clinical Recommendations • Further Cardiac testing
Coronary EBA Posterior Descending Coronary artery This 3 Dimensional Volume Rendered image demonstrates normal coronary arterial flow in the Posterior Descending Coronary artery to the apex of the heart as well as the coronary sinus and cardiac vein. This ECG triggered acquisition consisted of sixty, 3 mm images, each taken at 100 milliseconds. The total acquisition time was 45 seconds with an intravenous injection of 150 ml of contrast media.
Coronary EBA • Follow Up PTCA • This 3 Dimensional Volume Rendered image demonstrates a re-stenosis in the mid LAD coronary artery in a patient post PTCA • This ECG triggered acquisition consisted of sixty, 3 mm images, each taken at 100 milliseconds. The total acquisition time was 45 seconds with an intravenous injection of 150 ml of contrast media. G.O. Kerkhoff, Alfried Krupp Hospital Essen (2000)
Coronary EBA Coronary Artery Stent Scanning Protocol This 3 Dimensional Volume Rendered image demonstrates a 50% stenosis just proximal to the stent in the left anterior descending coronary artery . This ECG triggered acquisition consisted of sixty, 1.5 mm images, each taken at 100 milliseconds. The total acquisition time was 45 seconds with an intravenous injection of 150 ml of contrast media.
Coronary EBA Coronary Stent Courtesy of Milwaukee Heart Scan, Milwaukee, WI Virtual AngioscopyFLY THROUGH Volume rendering techniqueVRT Maximum intensity projectionMIP
Coronary EBA Right Coronary Artery Stent Stent - Ave gfxTM 3,0/30mm G.O. Kerkhoff, Alfried Krupp Hospital Essen (2000)
Coronary EBA Right Coronary Artery Bypass Graft – Distal anastomoisis G.O. Kerkhoff, Alfried Krupp Hospital Essen (2000)
Coronary EBA Right Coronary Artery Bypass Graft G.O. Kerkhoff, Alfried Krupp Hospital Essen (2000)
Coronary EBA Central occluded Right Coronary Artery Graft G.O. Kerkhoff, Alfried Krupp Hospital Essen (2000)
Coronary EBA Congenital Anomalies This 3 Dimensional Volume Rendered image demonstrates an aberrant circumflex coronary artery that arises from the Right coronary artery. This ECG triggered acquisition consisted of fifty, 3 mm images, each taken at 100 milliseconds. The total acquisition time was 35 seconds with an intravenous injection of 120 ml of contrast media.
Coronary and Thoracic EBA 76.94mm 77.99mm Large Thoracic Aneurysm G.O. Kerkhoff, Alfried Krupp Hospital Essen (2000)
Coronary and Thoracic EBA Thoracic aortic stent (Talent MedtronicTM) in dissection of the aorta True Lumen False Lumen G.O. Kerkhoff, Alfried Krupp Hospital Essen (2000)
Lung Scanning Continuous Volume Scan
Lung Scanning • Lung Scan Protocol • Patient Preparation: None • This Continuous Volume acquisition consisted of forty seven, 6 mm images, each taken at 300 milliseconds. The total acquisition time was 18 seconds. • Findings: Asbestosis
Lung Scanning • Lung Scan Protocol • Patient Preparation: None • This Continuous Volume acquisition consisted of forty seven, 6 mm images, each taken at 300 milliseconds. The total acquisition time was 18 seconds. • Findings: Lung Nodule Right Upper Lobe
Pulmonary Embolism • Pulmonary Embolism Acute Scan Protocol • Patient Preparation: None • This Continuous Volume acquisition consisted of 42, 6 mm images, each taken at 100 milliseconds. The total acquisition time was 5 seconds with an intravenous injection of 50 ml of contrast media @ 3 ml per second. • Findings: Large embolism in right and left main pulmonary arteries.
Pulmonary Embolism • Pulmonary Embolism Chronic Scan Protocol • Patient Preparation: NPO 4 hour prior to scanning. • This Continuous Volume acquisition consisted of 120, 3 mm images, each taken at 100 milliseconds. The total acquisition time was 5 seconds with an intravenous injection of 50 ml of contrast media @ 3 ml per second. • Maximum Intensity Projections
Abdominal Scanning Continuous Volume Scan
Abdominal Scan • Abdomen screen Protocol • Patient Preparation: Optional NPO after midnight the night prior to the exam. Drink 24 oz of gastrographin and H2o mix 2 hour prior and 12 oz before scanning. • This Continuous Volume acquisition consisted of, 6mm images, each taken at 400 milliseconds. The total acquisition time was 24 seconds.
Abdominal Scan • Abdomen Diagnostic Protocol • Patient Preparation: NPO after Midnight the night prior to the exam. Drink 24 oz of gastrographin and H2o mix 2 hour prior and 12 oz before scanning. • This Continuous Volume acquisition consisted of sixty one, 10 mm images, each taken at 600 milliseconds. The total acquisition time was 22 seconds with an intravenous injection of 90 ml of contrast media @ 2.0 ml per second.
EBT Colonography • EBT Colonography • Patient Preparation: 24 to 48 hour colon preparation. NPO after midnight the night prior to the exam. • This Continuous Volume acquisition consisted of 140, 3mm images, each taken at 200 milliseconds. The total acquisition time was 28 seconds with and air contrast enema.
Peripheral EBA Continuous Volume Scan
Renal EBA Renal Arteries This coronal Maximum Intensity Projection image demonstrates normal renal arterial flow. This Continuous Volume acquisition consisted of seventy, 3 mm images, each taken at 400 milliseconds. The total acquisition time was 28 seconds with an intravenous injection of 100 ml of contrast media.
Abdominal Aortic EBA • Abdominal Aortic EBA Scan Protocol • This 3D Volume Rendered image loop demonstrates arterial flow through a post operative abdominal aortic graft. • This Continuous Volume acquisition consisted of one hundred and forty, 3 mm images, each taken at 200 milliseconds. The total acquisition time was 28 seconds with an intravenous injection of 120 ml of contrast media.
Abdominal Aortic EBA Post operative Abdominal Aortic Graft G.O. Kerkhoff, Alfried Krupp Hospital Essen (2000) Maximum intensity projectionMIP Shaded surface displaySSD Volume rendering techniqueVRT
Femoral and Iliac EBA Femoral and iliac EBA Scanning Protocol • This coronal Maximum Intensity Projection image demonstrates arterial flow through a post operative abdomenoiliac graft. • This Continuous Volume acquisition consisted of one hundred and forty, 3 mm images, each taken at 200 milliseconds. The total acquisition time was 28 seconds with an intravenous injection of 120 ml of contrast media. G.O. Kerkhoff, Alfried Krupp Hospital Essen (2000)
Carotid EBA Carotid Arteries This 3 Dimensional Volume Rendered image demonstrate the the carotid arteries (RED) and venous circulation (BLUE). This Continuous Volume acquisition consisted of forty, 3 mm images, each taken at 300 milliseconds. The total acquisition time was 12 seconds with an intravenous injection of 60 ml of contrast media.
Head Scanning Continuous Volume Scan
Cerebral EBA Internal Carotid This axial Maximum Intensity Projection image demonstrates the Left internal carotid artery with limited flow to the Right. This Continuous Volume acquisition consisted of forty, 3 mm images, each taken at 600 milliseconds. The total acquisition time was 24 seconds with an intravenous injection of 80 ml of contrast media. G.O. Kerkhoff, Alfried Krupp Hospital Essen (2000)
Cerebral EBA Cerebral AVM This 3 Dimensional Volume Rendered image demonstrate the Circle of Willis with an Arterial Vascular Malformation (AVM). This Continuous Volume acquisition consisted of forty, 3 mm images, each taken at 600 milliseconds. The total acquisition time was 24 seconds with an intravenous injection of 100 ml of contrast media.
Cerebral EBA Cerebral EBA This axial Maximum Intensity Projection image demonstrates cerebral arterial flow. This Continuous Volume acquisition consisted of forty-five, 6 mm images, each taken at 600 milliseconds. The total acquisition time was 27 seconds with an intravenous injection of 100 ml of contrast media.
Head Scan • Head Scanning Protocol • Patient Preparation: NPO 4 hours before the scan. • This Continuous Volume acquisition consisted of forty one, 6 mm images, each taken at 600 milliseconds. The total acquisition time was 25 seconds with an intravenous injection of 90 ml of contrast media @ 2.0 ml per second.